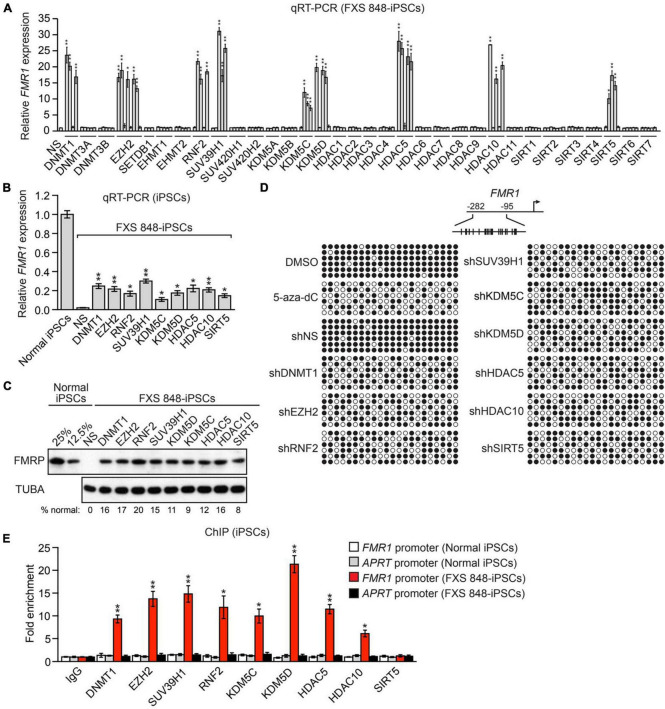
FIGURE 1.
A candidate-based RNAi screen identifies epigenetic regulators that mediate silencing of FMR1 in FXS patient-derived iPSCs. (A) qRT-PCR analysis monitoring expression of FMR1 in FXS 848-iPSCs expressing one of 162 shRNAs targeting a set of 33 epigenetic repressors. The results were normalized to that obtained with a control non-silencing (NS) shRNA, which was set to 1. (B) qRT-PCR analysis monitoring FMR1 expression in FXS 848-iPSCs 20 days following expression of an FMR1-SF shRNA. The results were normalized to that obtained in normal iPSCs, which was set to 1. (C) Immunoblot analysis showing FMRP protein levels in FXS 848-iPSCs 20 days following expression of an FMR1-SF shRNA. The levels of FMRP in normal iPSCs, diluted fourfold (representing the level of FMRP at 25% of normal levels) and eightfold (12.5%), are shown. α-tubulin (TUBA) was monitored as a loading control. The FMRP signal was quantified and normalized to that obtained in normal iPSCs, which was multiplied by the dilution factor and then set to 100%. (D) Bisulfite sequencing analysis of the FMR1 promoter in FXS 848-iPSCs treated with DMSO or 5-aza-2′-deoxycytidine (5-aza-dC), or with an NS or FMR1-SF shRNA. (Top) Schematic of the FMR1 promoter; positions of CpGs are shown to scale by vertical lines. (Bottom) Each circle represents a methylated (black) or unmethylated (white) CpG dinucleotide. Each row represents a single clone. (E) ChIP analysis monitoring binding of FMR1-SFs to the FMR1 promoter in normal and FXS 848-iPSCs. As a negative control, binding was also monitored at the constitutively expressed APRT promoter in normal and FXS 848-iPSCs. The results were normalized to that obtained with IgG, which was set to 1. Data are represented as mean ± SD (n = 3 biological replicates). *P < 0.05, **P < 0.01.

