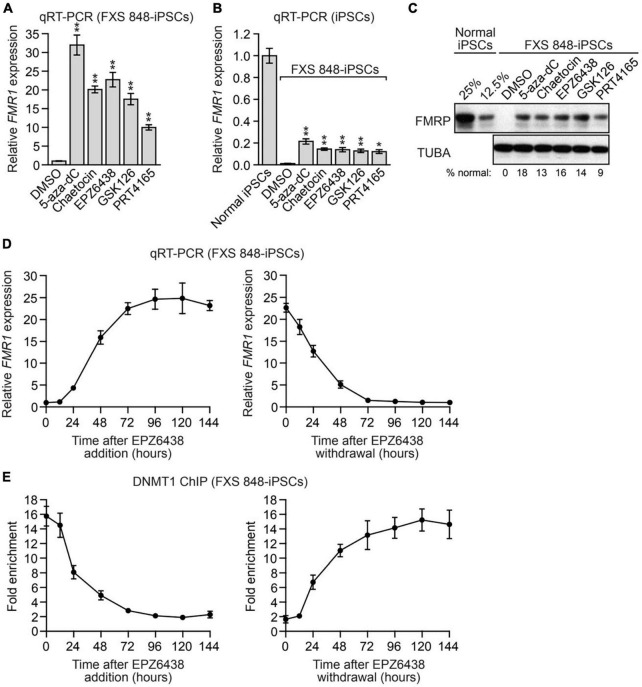
FIGURE 2.
Reactivation of epigenetically silenced FMR1 by small molecule FMR1-SF inhibitors. (A,B) qRT-PCR analysis monitoring FMR1 expression in FXS 848-iPSCs treated with 5-aza-dC, chaetocin, EPZ6438, GSK126, PRT4165 or, as a control, DMSO. The results were normalized to that obtained with DMSO (A) or in normal iPSCs (B), which was set to 1. (C) Immunoblot analysis monitoring FMRP levels in FXS 848-iPSCs treated with 5-aza-dC, chaetocin, EPZ6438, GSK126, PRT4165 or, as a control, DMSO. The FMRP signal was quantified and normalized to that obtained in normal iPSCs, which was multiplied by the dilution factor and then set to 100%. (D) qRT-PCR analysis monitoring FMR1 expression in FXS 848-iPSCs following EPZ6438 addition (left) or withdrawal (right). (E) ChIP analysis monitoring DNMT1 binding to the FMR1 promoter in FXS 848-iPSCs following EPZ6438 addition (left) or withdrawal (right). Data are represented as mean ± SD (n = 3 biological replicates). *P < 0.05, **P < 0.01.

