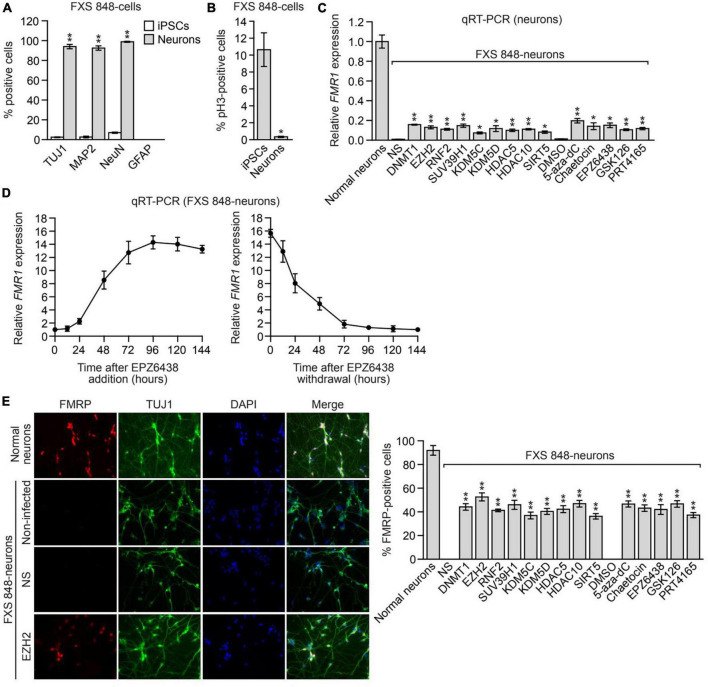
FIGURE 4.
The FMR1-SFs promote epigenetic silencing of FMR1 in FXS post-mitotic neurons. Percentage of TUJ1-, MAP2-, NeuN- and GFAP-positive cells (A) or phosphorylated H3- positive cells (B) in FXS 848-iPSCs and FXS 848-neurons. Data are represented as mean ± SD (n = 3 biological replicates with at least 300 cells analyzed per sample). (C) qRT-PCR analysis monitoring FMR1 expression in FXS 848-neurons expressing an FMR1-SF shRNA or treated with a small molecule FMR1-SF inhibitor. Data are represented as mean ± SD (n = 3 biological replicates). (D) qRT-PCR analysis monitoring FMR1 expression in FXS 848-neurons following EPZ6438 addition (left) or withdrawal (right). Neurons were treated with 5 μM EPZ6438 for 96h, then washed 3 times with PBS, refreshed with neuron growth medium, and collected at different time points for analysis. Data are represented as mean ± SD (n = 3 biological replicates). (E) Left, ICC monitoring FMRP levels in normal neurons and FXS 848-neurons expressing an NS or EZH2 shRNA, or in non-infected FXS 848-neurons (not expressing an shRNA). Right, Quantification of the percentage of FMRP-positive cells in FXS 848-neurons expressing an FMR1-SF shRNA or treated with a small molecule FMR1-SF inhibitor. Data are represented as mean ± SD (n = 3 biological replicates with at least 300 cells analyzed per sample). *P < 0.05, **P < 0.01.

