
Figure 3.
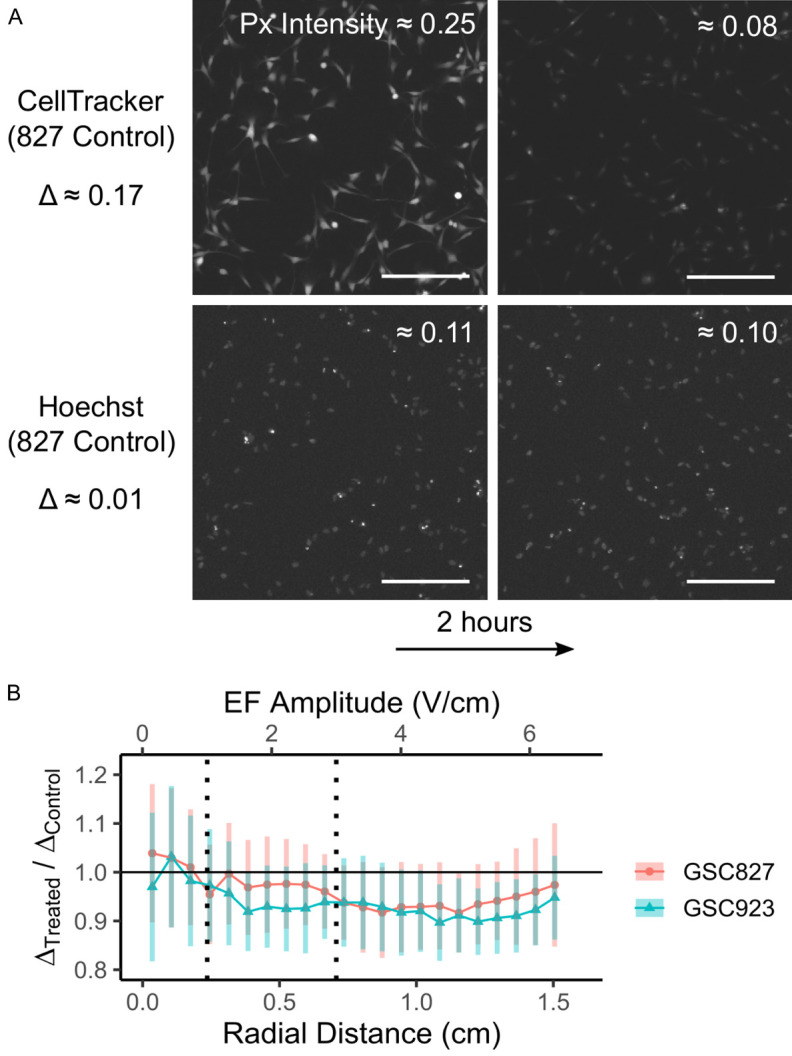
Results for pumping activity. A. Exemplar images taken from near the center region of a control GSC827 dish (scale bar = 0.25 mm). All images are shown with a flat, normalized brightness increase of 0.15 to aid visualization. Note that the decrease in segmented px intensity, Δ, is much greater for CellTracker than for Hoechst. B. Ratio of the measured intensity drop of CellTracker over 2 hours, Δ, for treated and control conditions in GSC827 and GSC923. N = 12, 18 for GSC827 and GSC923, respectively. Error bars = 90% confidence intervals from bootstrapped pair-wise differences with 1000 re-samplings.