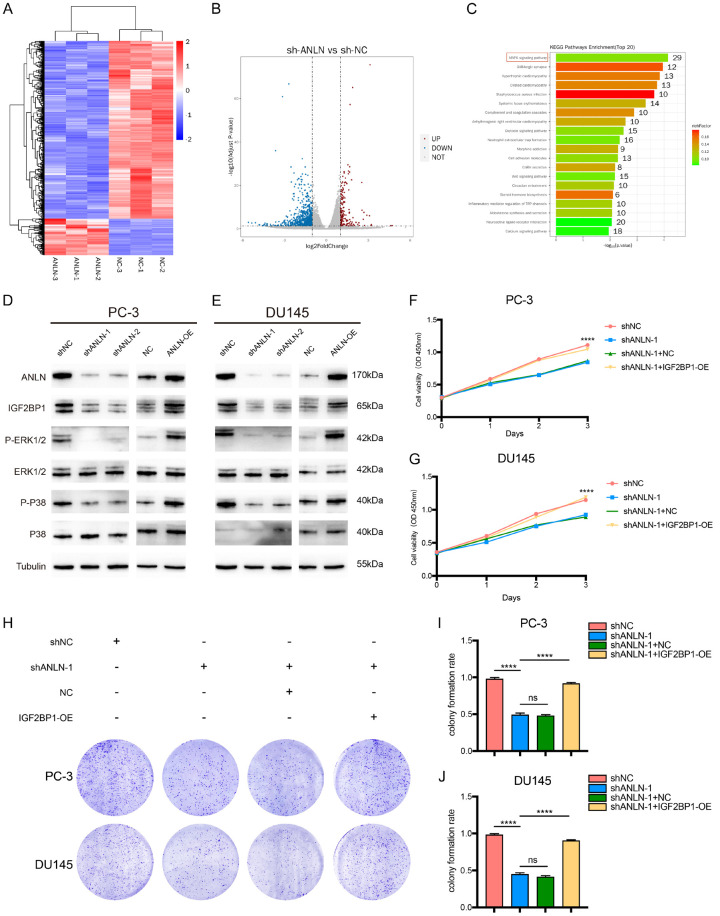
Figure 6.
ANLN expression was positively correlated with IGF2BP1 expression and MAPK pathways in PCa cells. A. Heatmap illustrating the differentially expressed genes (DEGs) in DU145 cells between shNC group and ANLN knockdown group. B. Volcano map showing the DEGs in DU145 cells between shNC group and shANLN group. C. KEGG pathway analysis of differently expressed genes based on ANLN-knockdown DU145 cell. D, E. Western blotting analysis of IGF2BP1 and MAPK associated proteins expression in PC-3 and DU145 cells. F, G. Cell mobility was assessed by CCK-8 assays in cells expressing the different constructs. ****P < 0.0001. H-J. Representative images and quantification of total colonies formed in PC-3 and DU145 cells expressing different vectors. ns P ≥ 0.05, ****P < 0.0001.

