Figure 1.
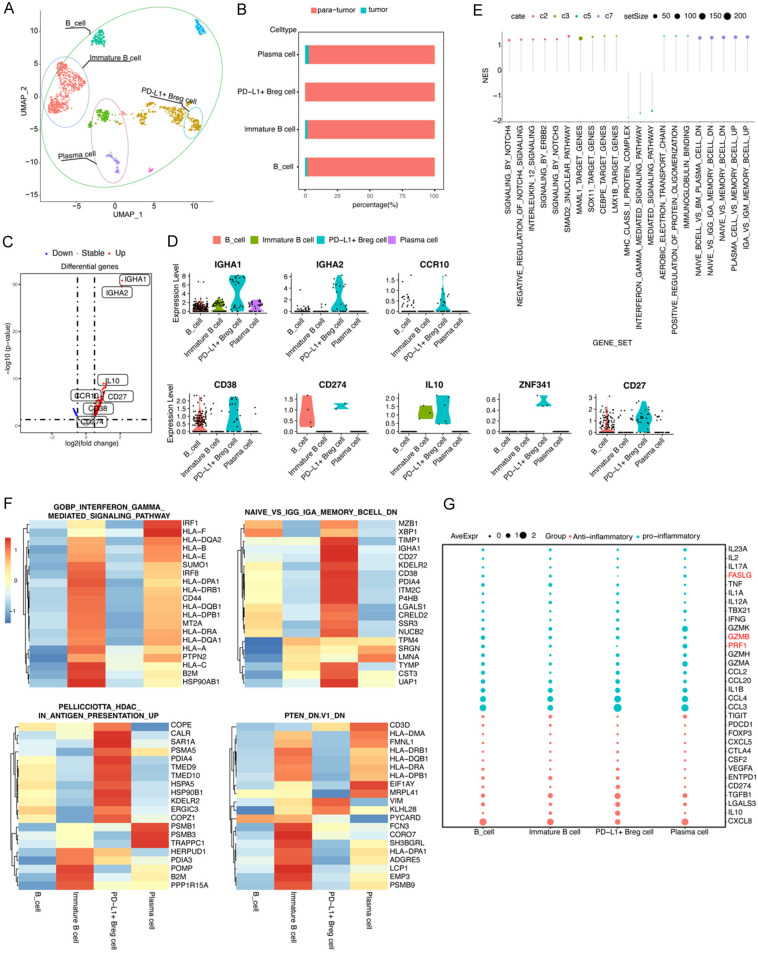
High PD-L1 expression Bregs were spotted as a subset of infiltrated B cells in human HCC indicated through a single-cell RNA-seq. A. The UMAP plot of single B cells obtained from one patient, representing four distinct clusters including PD-L1+ Breg cells. Each dot corresponds to one single cell, and circles are colored according to cell clusters. B. Relative abundance of four types of B cells in scRNA-seq analysis of human liver samples obtained from tumor and para-tumor liver sites. C. A volcano plot of differentially expressed genes (DEGs) is compared between PD-L1+ Breg cells and other B cells. Each colored dot denotes an individual gene with an adjusted p-value of <0.05. D. Violin plots of significant markers in four types of B cells. E. GSEA analysis using C2, C3, C5, and C7 gene sets. F. A heatmap of the top 20 genes expressed in four pathways. G. A dot plot of the expression of pro-inflammatory and anti-inflammatory genes in four types of B cells.

