Figure 2.
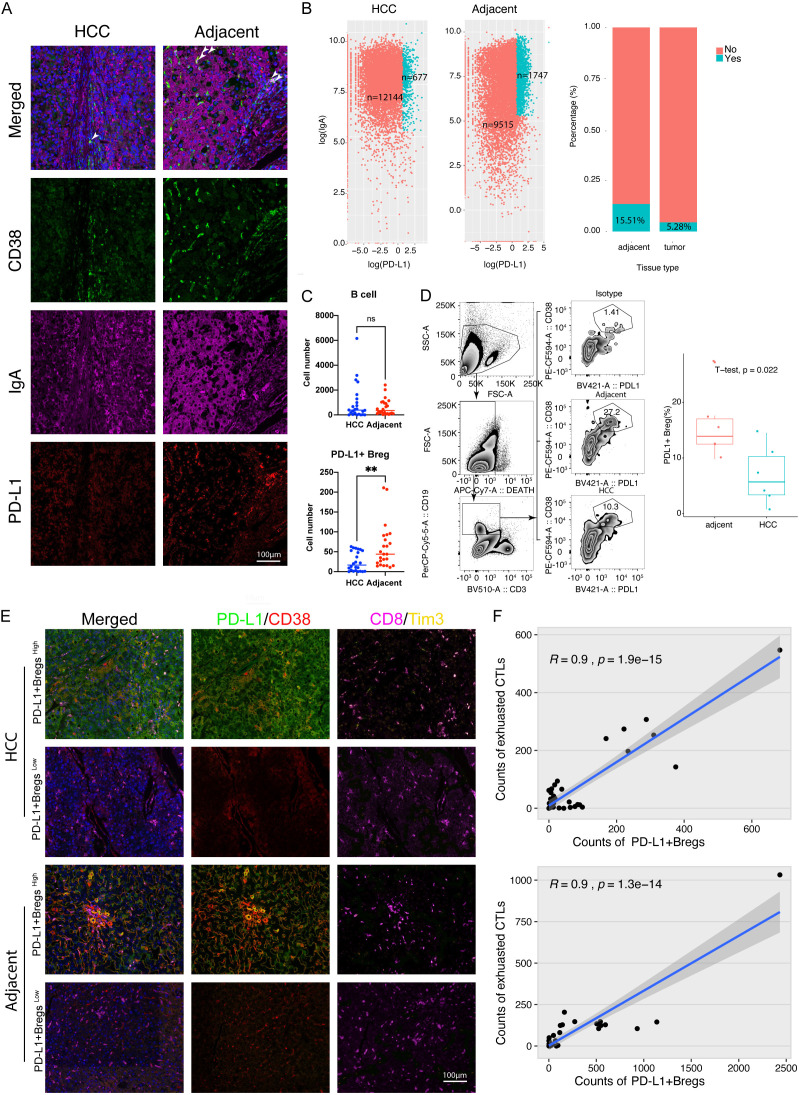
High PD-L1 expression Bregs were mainly located in adjacent HCC tissues and associated with exhausted CTLs in human HCC. A. Representative figures (×200 magnification) of multiple-color staining for CD38, PD-L1, and IgA expression in human HCC and adjacent tissue. B. Plots showing the number (left panel) and percentage (right panel) of IgA+PD-L1+ Breg cells in human HCC and adjacent tissue. C. A quantitative comparison of B cells and IgA+ PD-L1+ B cells in HCC and adjacent tissue using multiple-color staining. Data are presented as means ± SEM and were analyzed with Student’s t-test (**, P<0.01; ns, no significance, P>0.05). D. Comparison and gating strategy of CD19(+) CD38(+) PD-L1(+) Breg cell in TILs of human HCC analyzed by flow cytometry. E. Representative figures (×200 magnification) of multiple-color staining for PD-L1, CD38, CD8, and Tim3 expression in human HCC and adjacent tissues. F. Liner correlation studies were performed between the number of PD-L1+ B cells and exhausted T cells in HCC and adjacent tissue.

