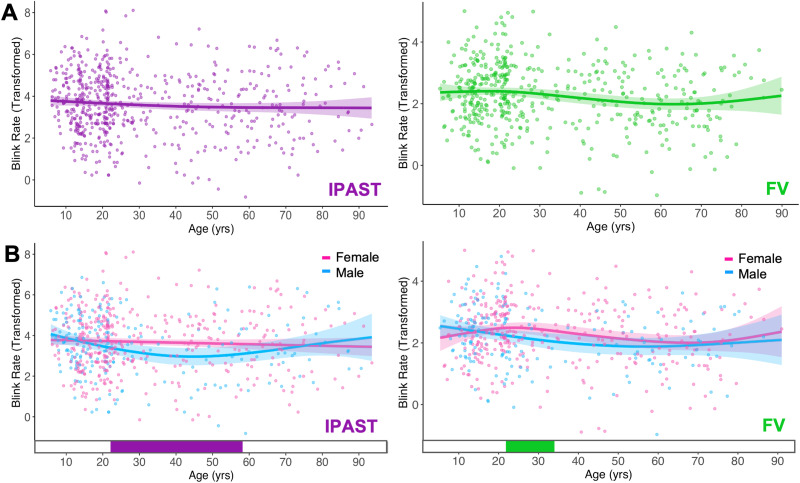
Figure 3.
GAM fits and significant periods of change in IPAST (left) and FV (right). Scatter points are individual subjects, curves are the GAM fits colored accordingly, and shaded ribbons are the 95% CIs. A, Blink rate modeled as a continuous function of age. There were no significant periods of age-related change in either task. B, Blink rate modeled as a continuous function of age, with participant sex as a factor. The bottom tile indicates the ages where sexes significantly differ (22–58 years in IPAST; 22–34 years in FV).

