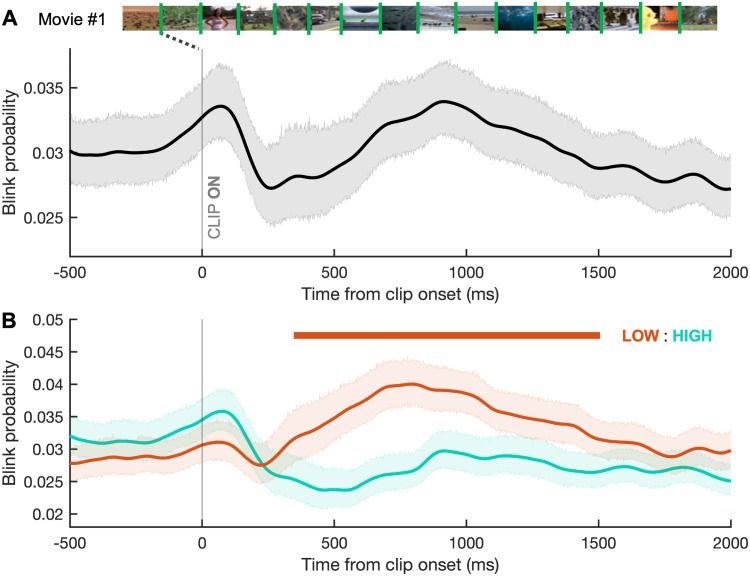
Figure 6.
Blink behavior in FV. A, Analysis of blink probability relative to clip onset across all FV movies. Movie #1 shown across the top, with clip changes indicated with green lines between the 16 clips. Shaded area represents the 95% CIs. B, Blink probability relative to clip onset in FV, separated by the degree of gaze clustering of the new clip (HIGH, teal line; LOW, orange line). Horizontal bars represent periods where curves differ significantly and are colored according to the clip type with the higher blink probability at that time. Shaded area represents the 95% CIs.

