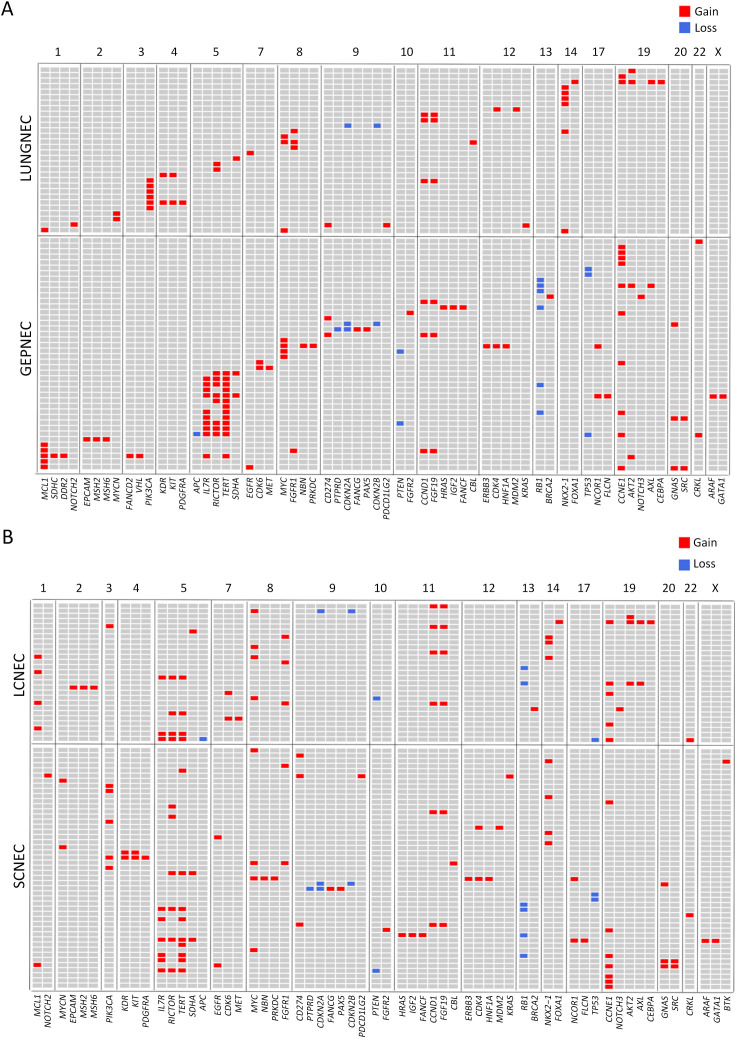
Figure S5.
CNV analysis between GEPNEC and LNEC. (A) Graphics representing CNV data by sites of origins. The gain or loss of CNV regions in each clade is labeled with colored boxes. Red, gain; blue, loss; (B) Graphics demonstrating CNV data through pathology. GEPNEC, gastroenteropancreatic neuroendocrine carcinoma; LNEC, lung NEC; CNV, copy number variation.

