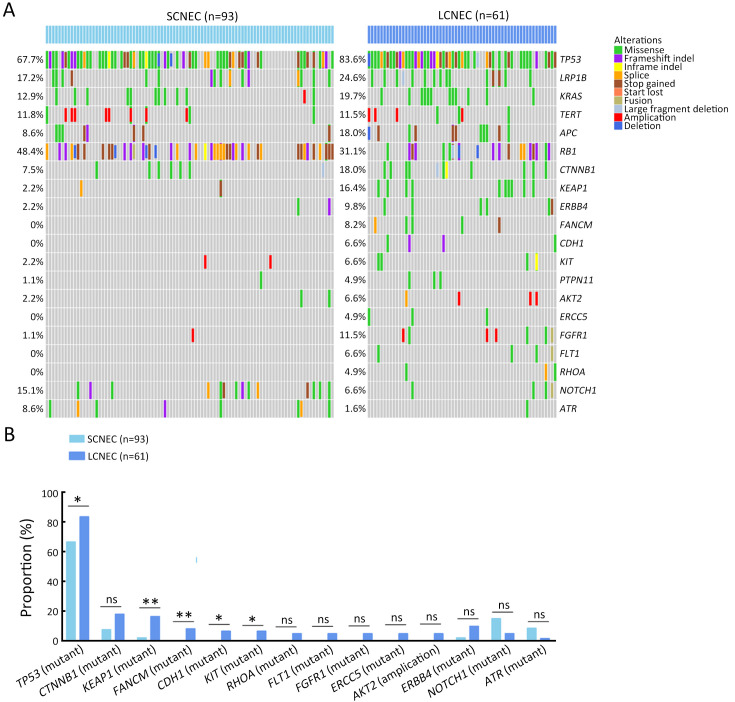
Figure S8.
Summary of alteration frequency of SCNEC vs. LCNEC. (A) Oncoprints showing the top most frequent and significant gene alterations between SCNEC and LCNEC; (B) Bar plots of pathway alteration proportions of SCNEC and LCNEC. SCNEC, small-cell neuroendocrine carcinoma; LCNEC, large-cell neuroendocrine carcinoma. P values were determined using Fisher’s exact test. *, P<0.05; **, P<0.01; ns, no significance.

