
Figure 1. Intragenic deletion results in unexpected epigenetic silencing at the Sox2 locus.
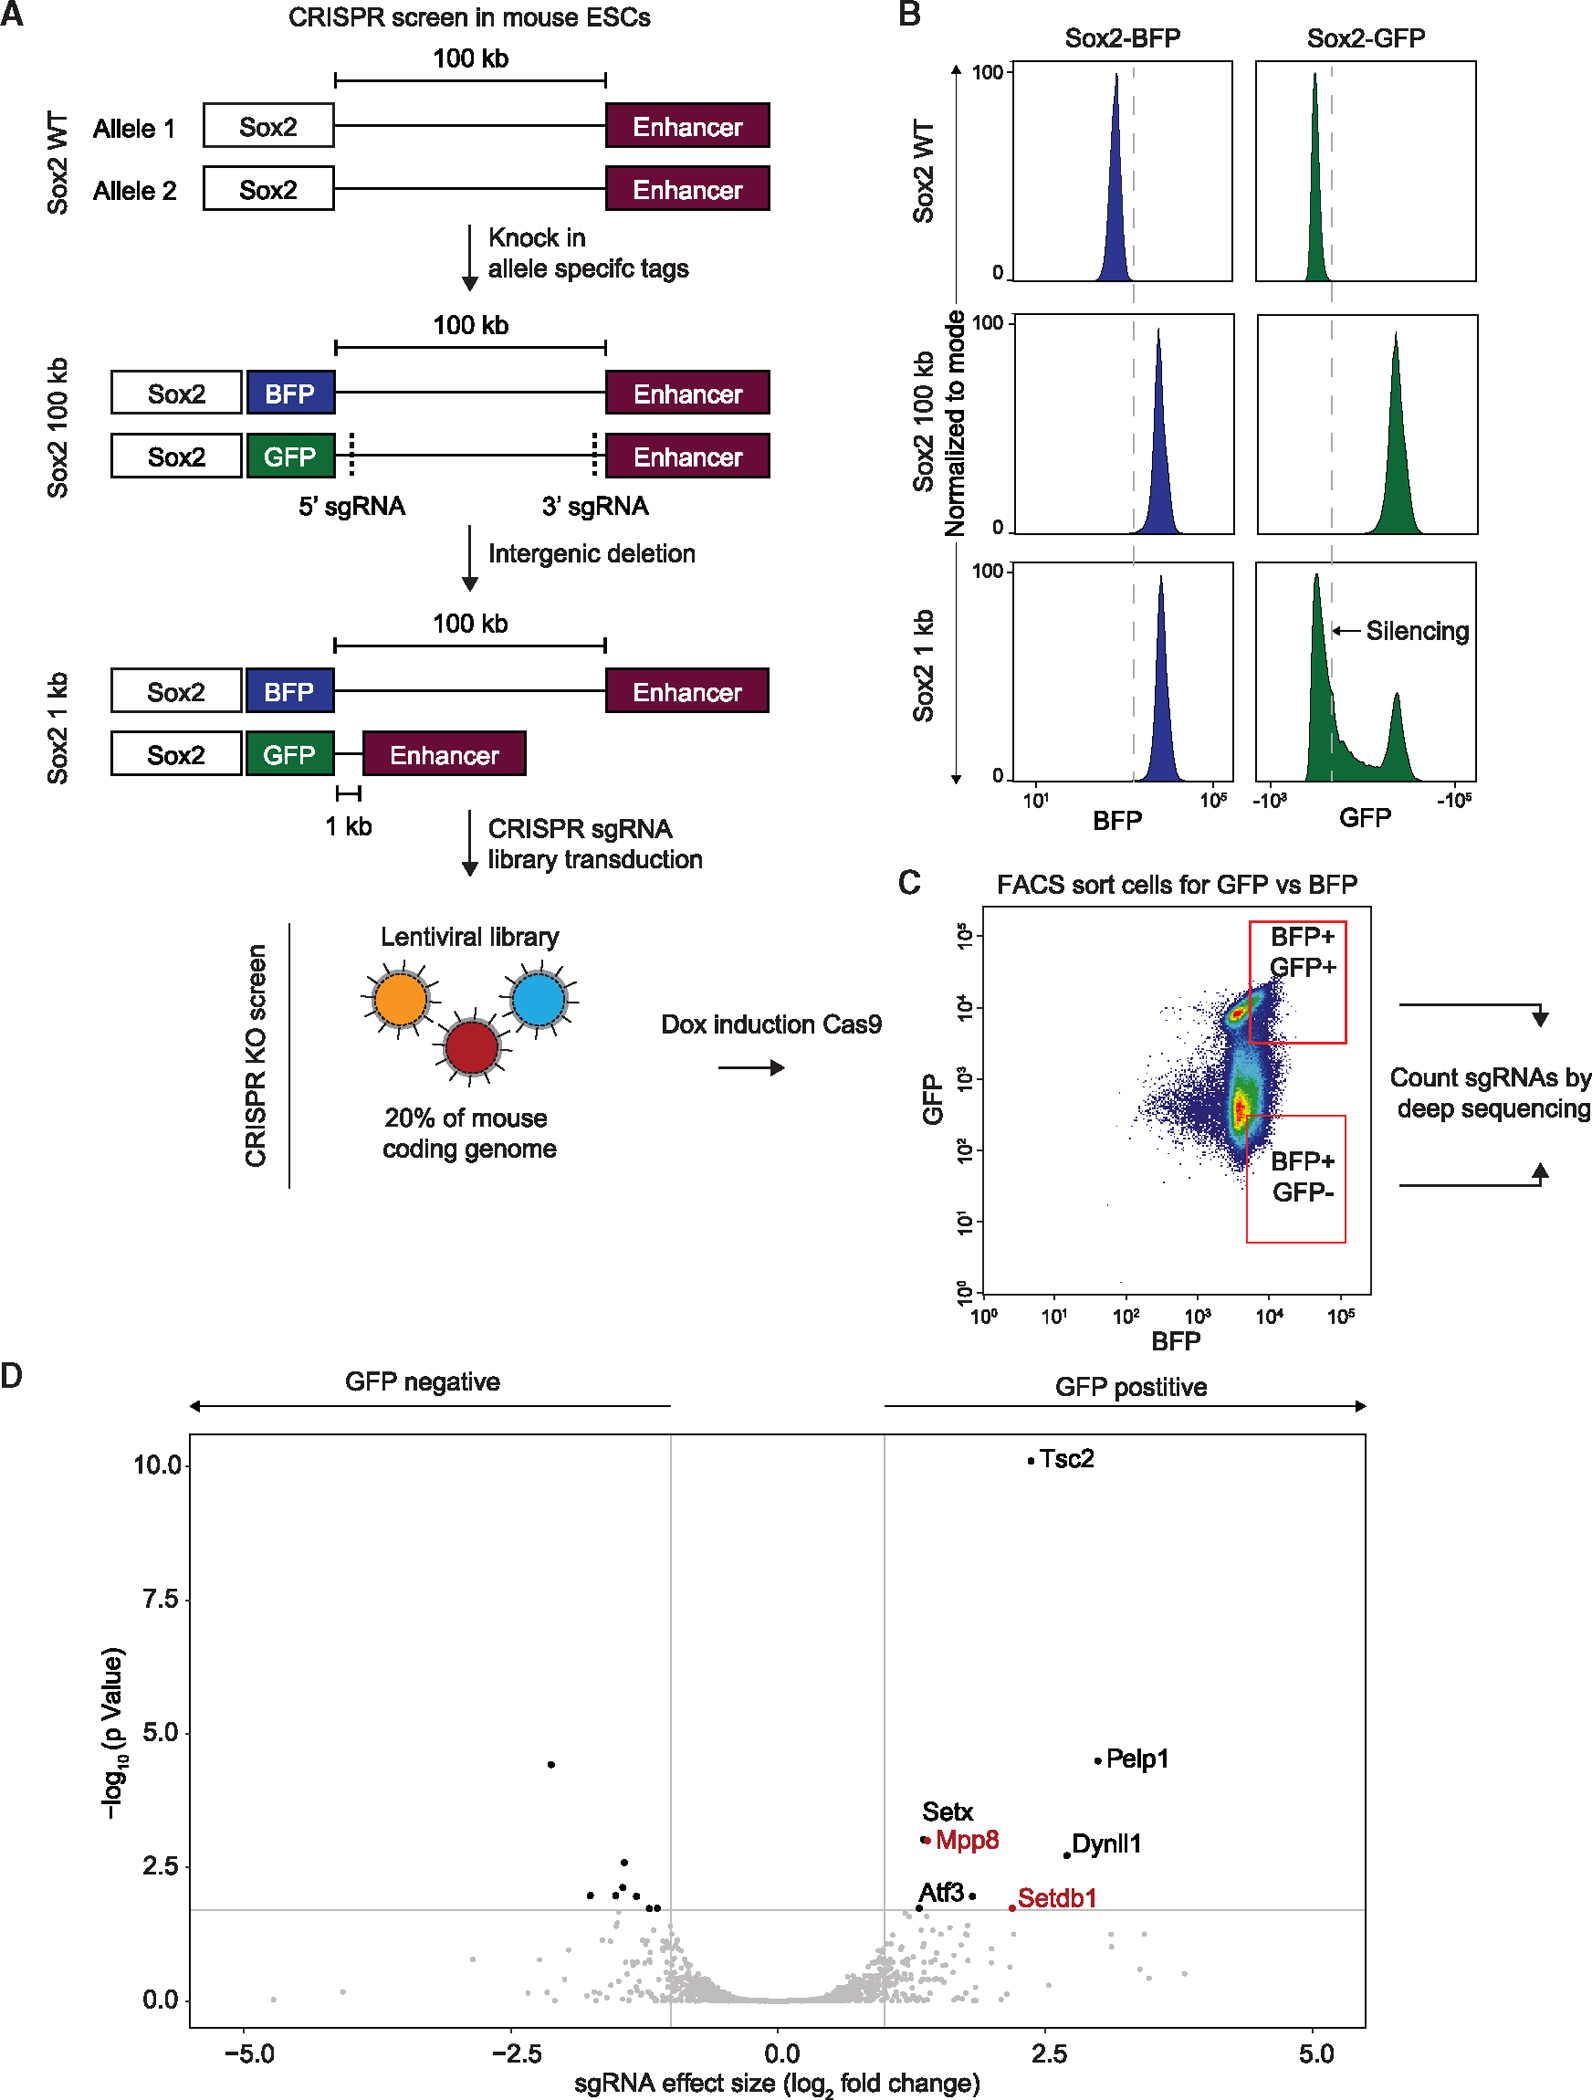
(A) Schematic diagram of the Sox2 locus and its associated CRISPR-Cas9 screen in mESCs: in WT mESCs, Sox2, and its super-enhancer are separated by a 100 kb gene desert (top). Allele-specific GFP and BFP tags were integrated into the Sox2 gene (middle) and two sgRNA were used to delete the space between Sox2 and its enhancer (bottom). CRISPR screen was conducted by transducing a library of sgRNAs covering 20% of the mouse coding genome and induction of Cas9 expression (bottom).
(B) Fluorescence-activated cell sorting (FACS) histogram plots of BFP (left) and GFP (right) in WT (top), Sox2-100kb (center), and Sox2-1kb (bottom) mESCs.
(C) FACS 2D plots of BFP (x axis) and GFP (y axis) in Sox2–1kb mESCs following transduction with sgRNA library covering 20% of the mouse coding genes and after induction of Cas9 expression. Marked in red is the gating strategy that was used to sort BFP+/GFP+ and BFP+/GFP− populations, which was followed by deep-sequencing and differential analysis of sgRNAs enrichment.
(D) Differential enrichment of sgRNAs between GFP-positive and GFP-negative populations that were sorted in (C) as calculated by DE-Seq. Marked in red aregenes associated with the HUSH complex.