
Figure 3. Two classes of HUSH targets distinguished by H3K9me3, transposon content, and response to HUSH depletion.
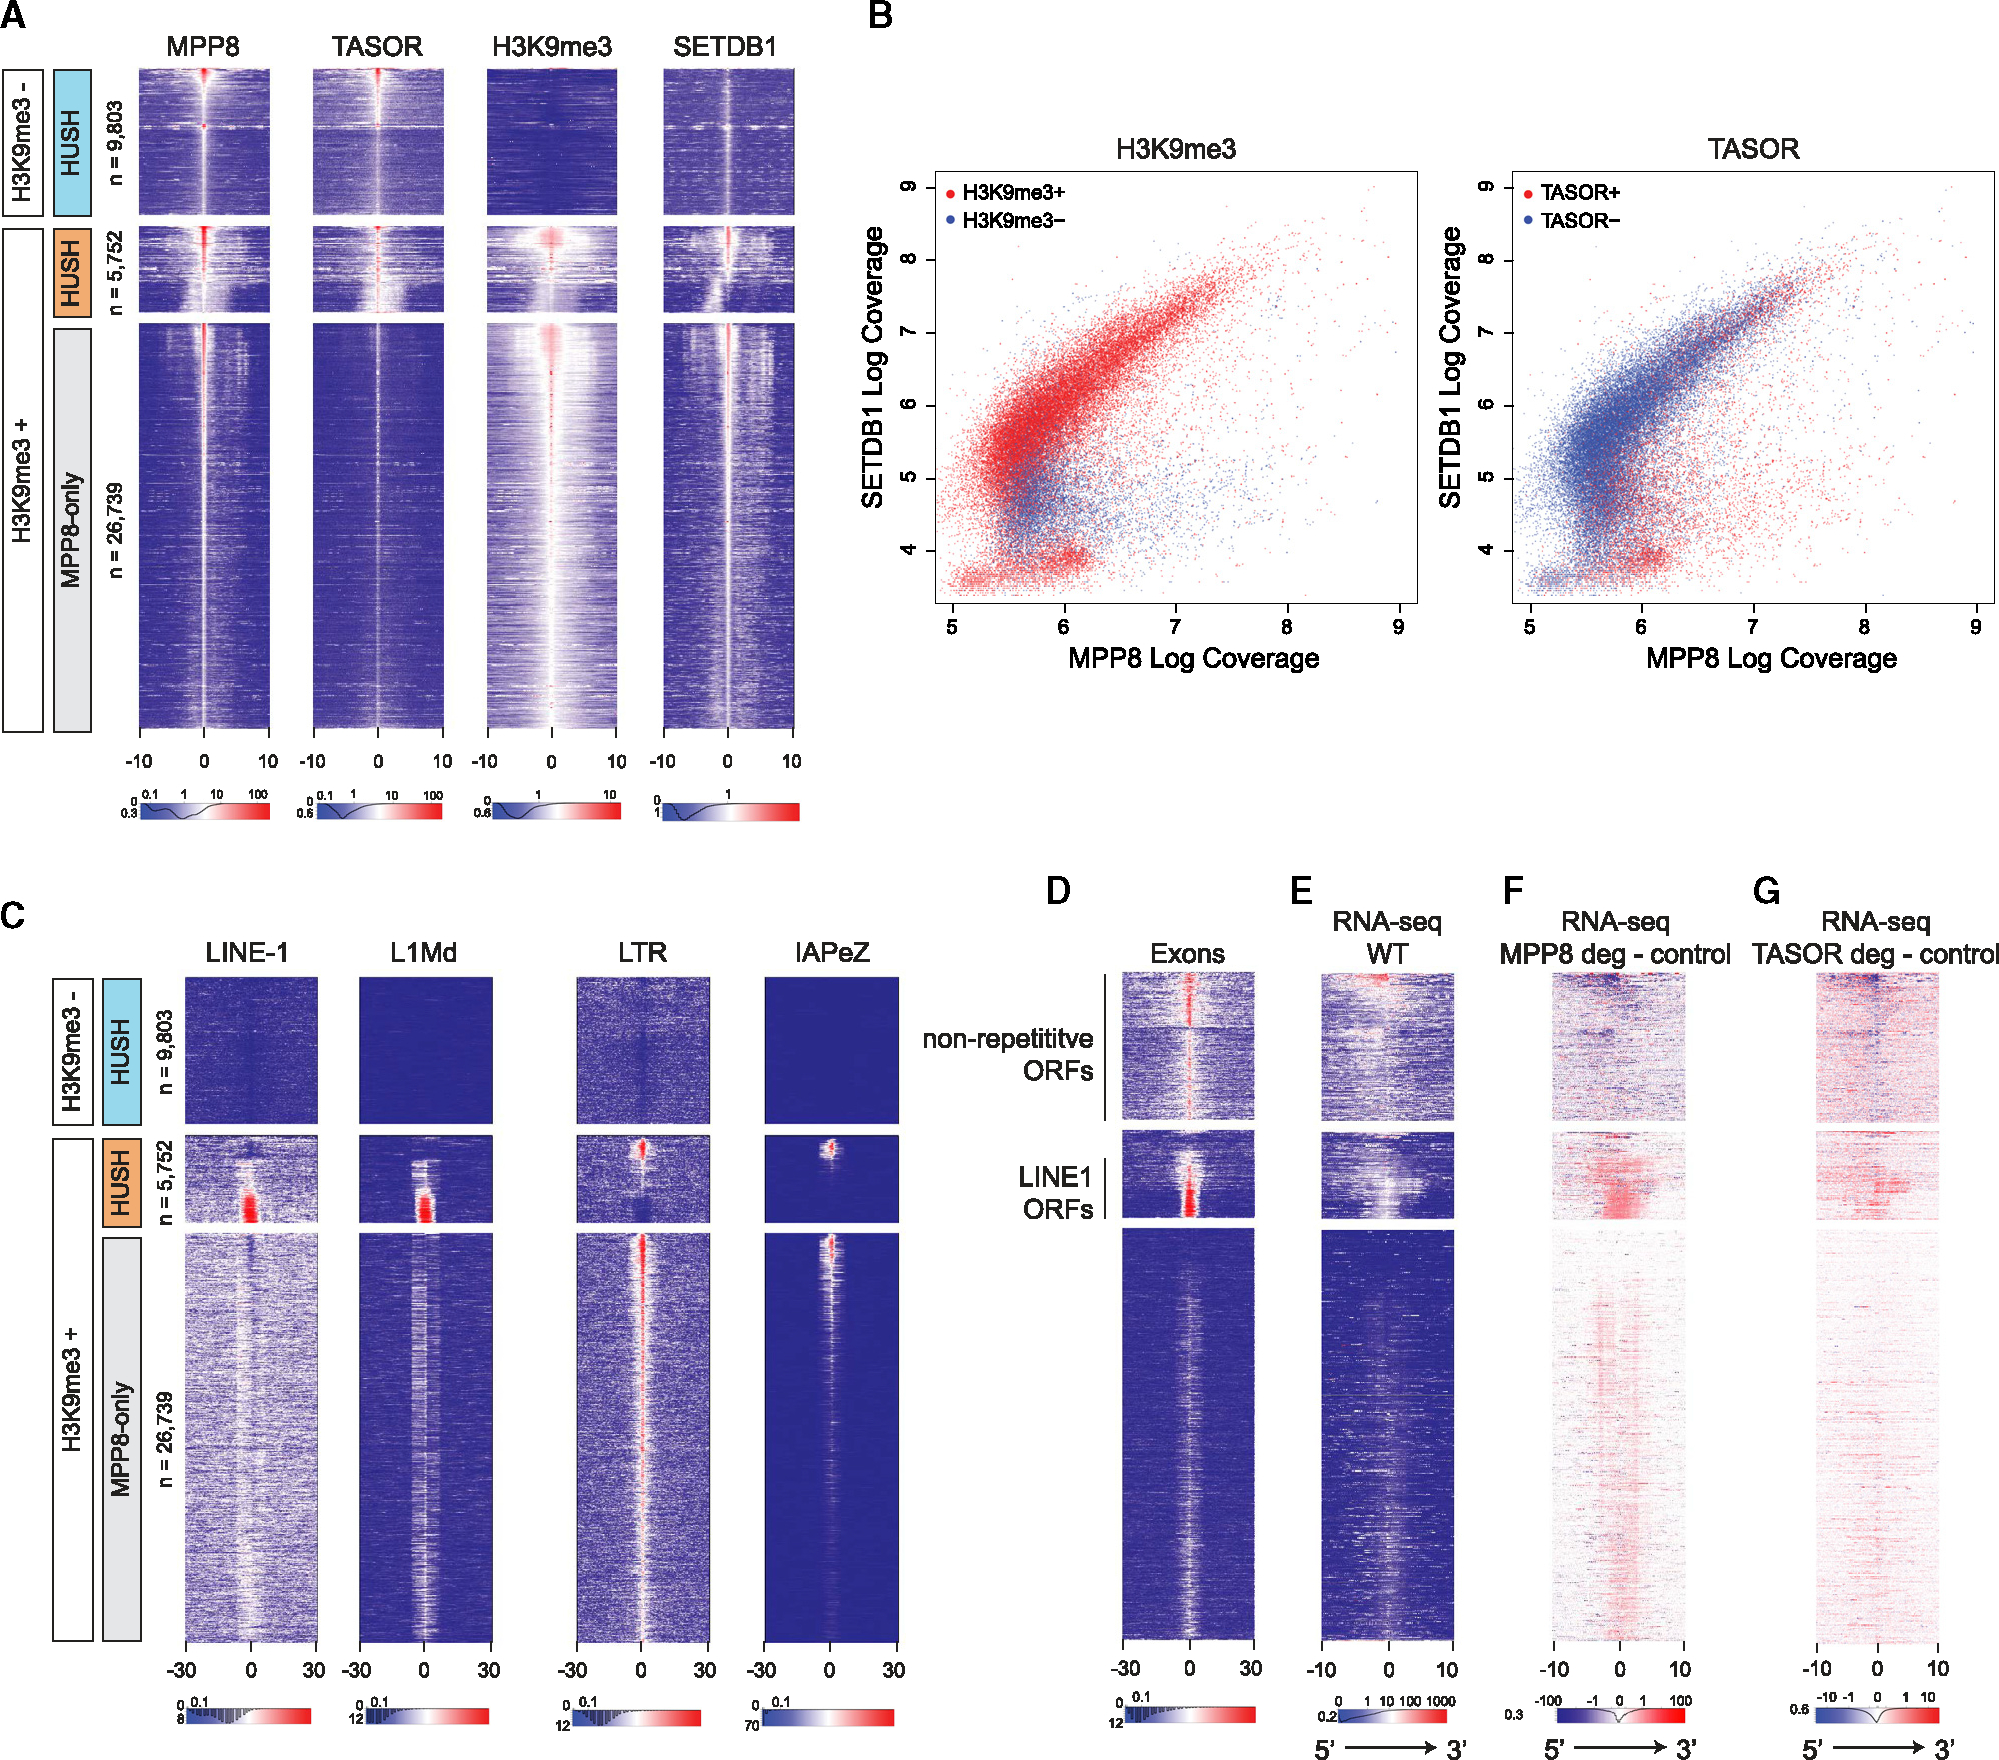
(A) Heatmaps showing ChIP-seq coverage for MPP8, TASOR, H3K9me3, and SETDB1 at MPP8 peaks. The x axis represents distance from MPP8 ChIP peak in kb. Heatmaps were sorted first by H3K9me3 and then by MPP8 and TASOR signal. Regions with high coverage of both MPP8 and TASOR were classified as HUSH targets (H3K9me3-positive; orange and H3K9me3-negative; light blue), whereas regions with low or no TASOR were delineated as MPP8-only (gray). The number of peaks for each class (n) is indicated. ChIP peak orientation in heatmaps is stranded based on the ratio of positive- and negative-stranded PRO-seq signals.
(B) Scatterplots showing all MPP8 and TASOR ChIP-seq peaks as a function of log coverage for MPP8 (x axis) and SETDB1 (y axis) ChIP-seq. Marked in red are peaks overlapping H3K9me3 (left) or TASOR (right).
(C) Heatmaps showing the presence and relative position of repetitive elements as annotated by repeat masker, centered and sorted as in (A). The x axis represents distance from MPP8 ChIP peak in kb.
(D) Heatmaps showing relative position of transcribed exons as annotated by custom transcriptome models derived from RNA-Seq of WT mESCs, centered and sorted as in (A). The x axis represents distance from MPP8 ChIP peak in kb.
(E) Heatmaps showing RNA-seq coverage in WT mESCs, centered and sorted as in (A). The x axis represents distance from MPP8 ChIP peak in kb.
(F) Heatmaps showing subtraction of RNA-seq coverage in MPP8-depleted mESCs (treated with auxin for 7 days) from control mESCs, centered and sorted as in (A). The x axis represents distance from MPP8 ChIP peak in kb.
(G) Heatmaps showing subtraction of RNA-seq coverage in TASOR-depleted mESCs (treated with auxin for 1 day) from untreated control mESCs, centered and sorted as in (A). The x axis represents distance from MPP8 ChIP peak in kb.