
Figure 4. The HUSH complex interacts with RNA polymerase II termination factors and binds nascent RNA.
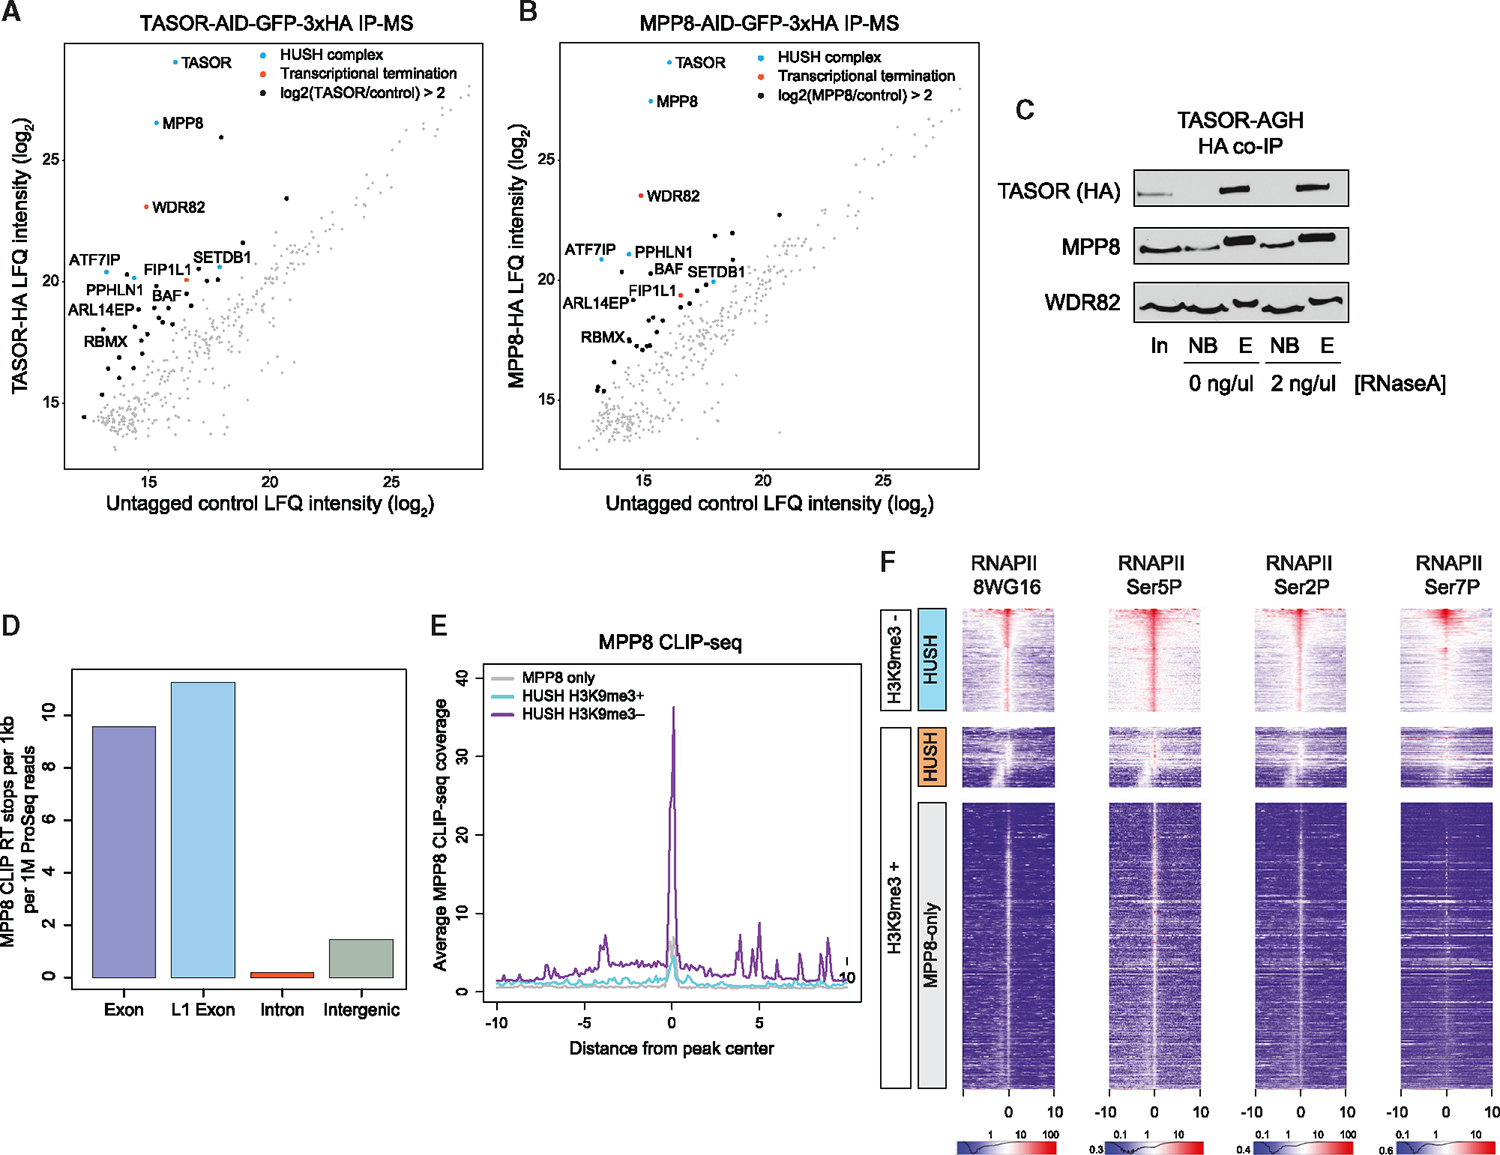
(A) Log of label-free quantification (LFQ) intensity for HA immunoprecipitation (IP) followed by mass-spectrometry in TASOR-AGH (y axis) and untagged control mESCs (x axis). Colored dots highlight associations of proteins with the HUSH complex (blue) or with RNA polymerase II (red).
(B) Same as (A), for MPP8-AGH IP-MS.
(C) Western blot showing coIP of MPP8 and WDR82 with TASOR (HA IP) in the TASOR-AGH cell line. Samples were incubated with RNaseA at 2 ng/μL during the IP. Inputs (in), non-bound flowthrough (NB), and HA peptide eluted (E) fractions at shown.
(D) Enrichment of MPP8 irCLIP-seq for various genomic features. y axis was calculated by normalizing the number of RT stops to both length and level of transcription, as measured by PRO-seq. Exons were annotated by custom transcriptome models derived from RNA-seq of WT mESCs.
(E) Aggregate plot showing MPP8 CLIP-seq normalized read count (y axis) relative to the distance from HUSH or MPP8-only ChIP peaks (x axis). HUSH peaks were divided into H3K9me3-positive (blue), H3K9me3-negative (purple), or MPP8-only regions based on the classification in Figure 3A.
(F) Heatmaps showing ChIP-seq coverage for RNA polymerase II using different antibodies that recognize various C-terminal domain (CTD) modifications, centered and sorted as in Figure 3A. The x axis represents distance from MPP8 ChIP peak in kb.