. 2024 Feb 5;15(10):3633–3639. doi: 10.1039/d3sc06058f

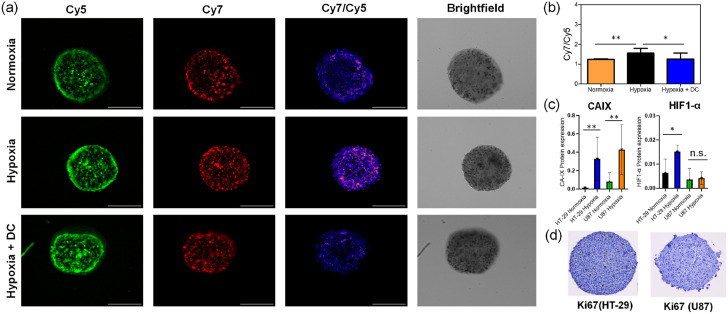
Fig. 4. (a) Representative images of 3D tumor spheroids composed of HT-29 cells grown under normoxic (20% O2) condition for 48 hours and then maintained under normoxic or hypoxic (1% O2) condition for 24 hours (day 3) before being treated with RNP (20 μM) for 1 hour. NTR inhibition studies were performed by treating the hypoxic HT-29 spheroids with 200 μM dicoumarol (DC) for 1 hour before the addition of RNP. The spheroids were fixed in 4% paraformaldehyde and imaged with the emission filter channels, Cy5 (663–737 nm), Cy7 (780–900 nm), length scale 270 μm. (b) Quantification for Cy7/Cy5 fluorescence ratio for N = 12 HT-29 spheroids for each hypoxia or hypoxia condition, N = 5 spheroids for hypoxia + DC condition. (c) Quantification of the hypoxia biomarkers Carbonic Anhydrase IX (CA-IX) and Hypoxia Inducible Factor 1α (HIF-1α) in HT-29 or U87 spheroids (N = 6 or 7 images of sectioned spheroids per cell-line per condition) visualized in thin spheroid cryosections by immunohistochemical staining. (d) Representative images of thin sectioned HT-29 and U87 tumor spheroids with immunohistochemical staining of the nucleus (blue) and proliferation biomarker Ki67 (brown) showing no necrotic core. n.s. (not significant) p > 0.05, *p ≤ 0.05, **p ≤ 0.01.

Fig. 4