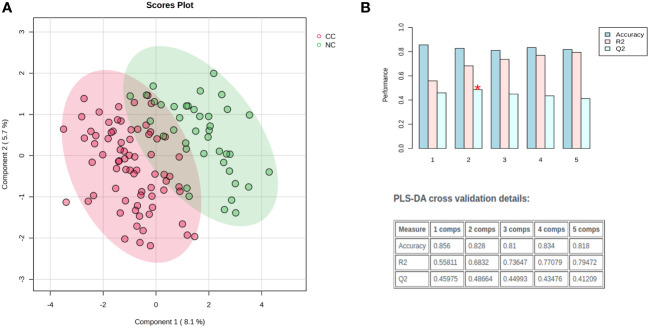
Figure 2.
Exploratory multivariate statistical analysis. (A) Partial least square discriminant analysis (PLS-DA) score plots distinct clustering of cachectic (red) and non-cachectic (green) cancer patients. (B) The PLS-DA model was evaluated for its validity using a random permutation test that involved 100 permutations. The plot generated after the test highlighted the best classifier (a red asterisk) with an R2 value of 0.69, indicating the amount of variance explained by the model, and a Q2 value of 0.48, which indicated its predictive ability. A high R2 and Q2 value indicates good predictive ability and confirms the validity of the PLS-DA model. The accuracy of the best model is summarized in an inset table, which includes Q2, R2, and the number of components used in the model. “Comps” refer to the number of components.

