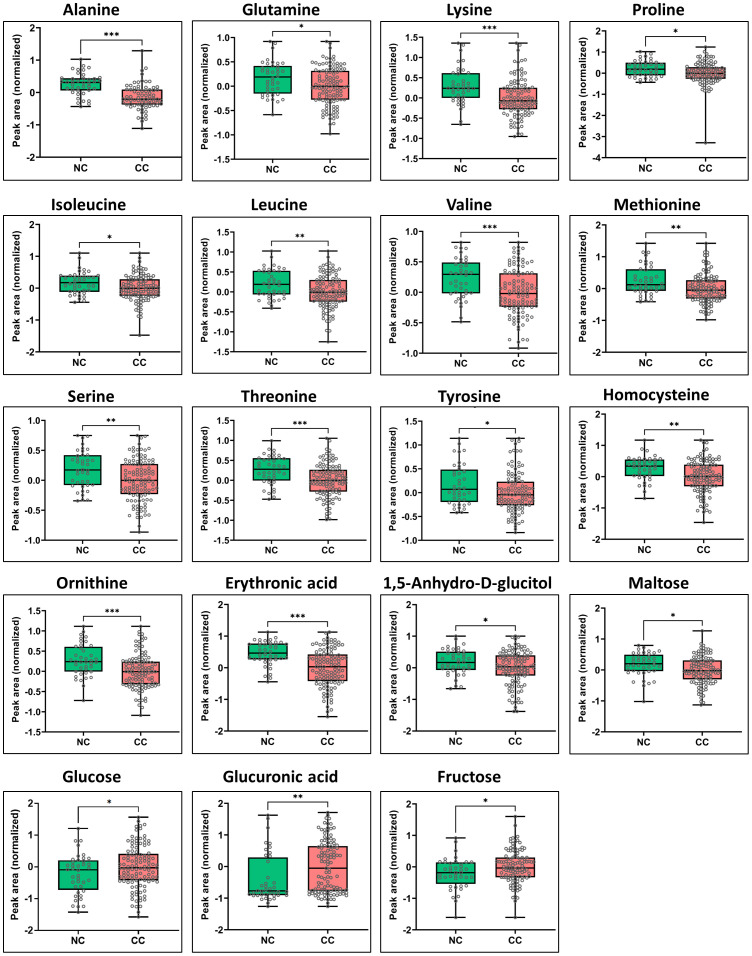
Figure 3.
Box-and-whisker and dot plots showing significant differences in serum levels of specific metabolites between cachectic and non-cachectic cancer patients. Specific significant metabolite differences were obtained after Tukey’s HSD and illustrated as normalized peak area differences. *P ≤ 0.05; **P ≤ 0.01; *** P ≤ 0.0001 and all lower values.

