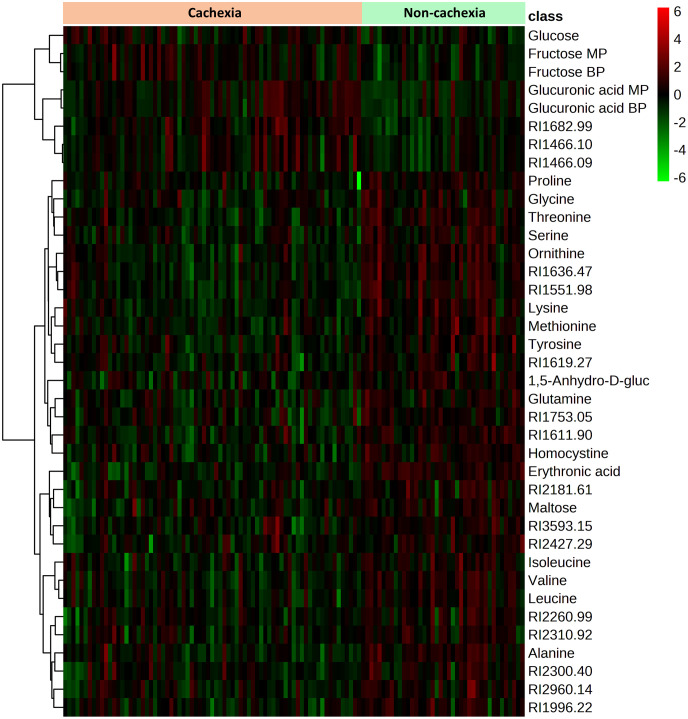
Figure 4.
Heatmap showing the 38 metabolites with significant differences in serum level between cachectic and non-cachectic cancer patients. Significant differences were determined by false discovery rate (FDR)-corrected t-test p-values (FDR-corrected p < 0.05) to adjust for multiple hypothesis testing. The colors from green to red indicate increased metabolite concentration (normalized peak area).

