Figure 7.

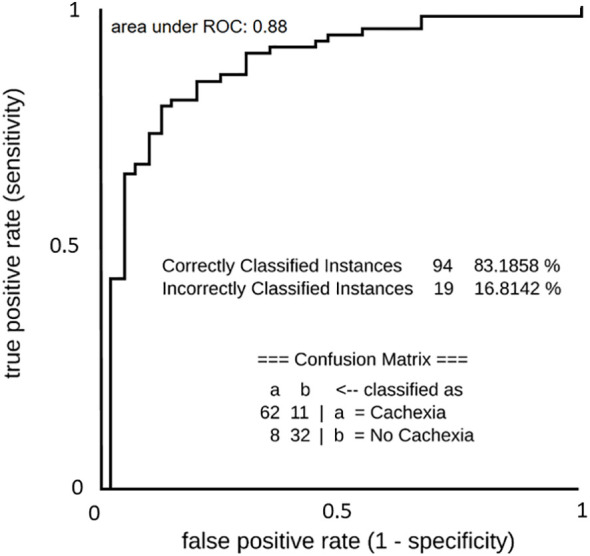
ROC curve of predictive machine learning (ML) models (Simple Logistics) for binominal discrimination between cachectic and non-cachectic state. List below ROC curve shows the confusion matrix and accuracy value of the model.

ROC curve of predictive machine learning (ML) models (Simple Logistics) for binominal discrimination between cachectic and non-cachectic state. List below ROC curve shows the confusion matrix and accuracy value of the model.