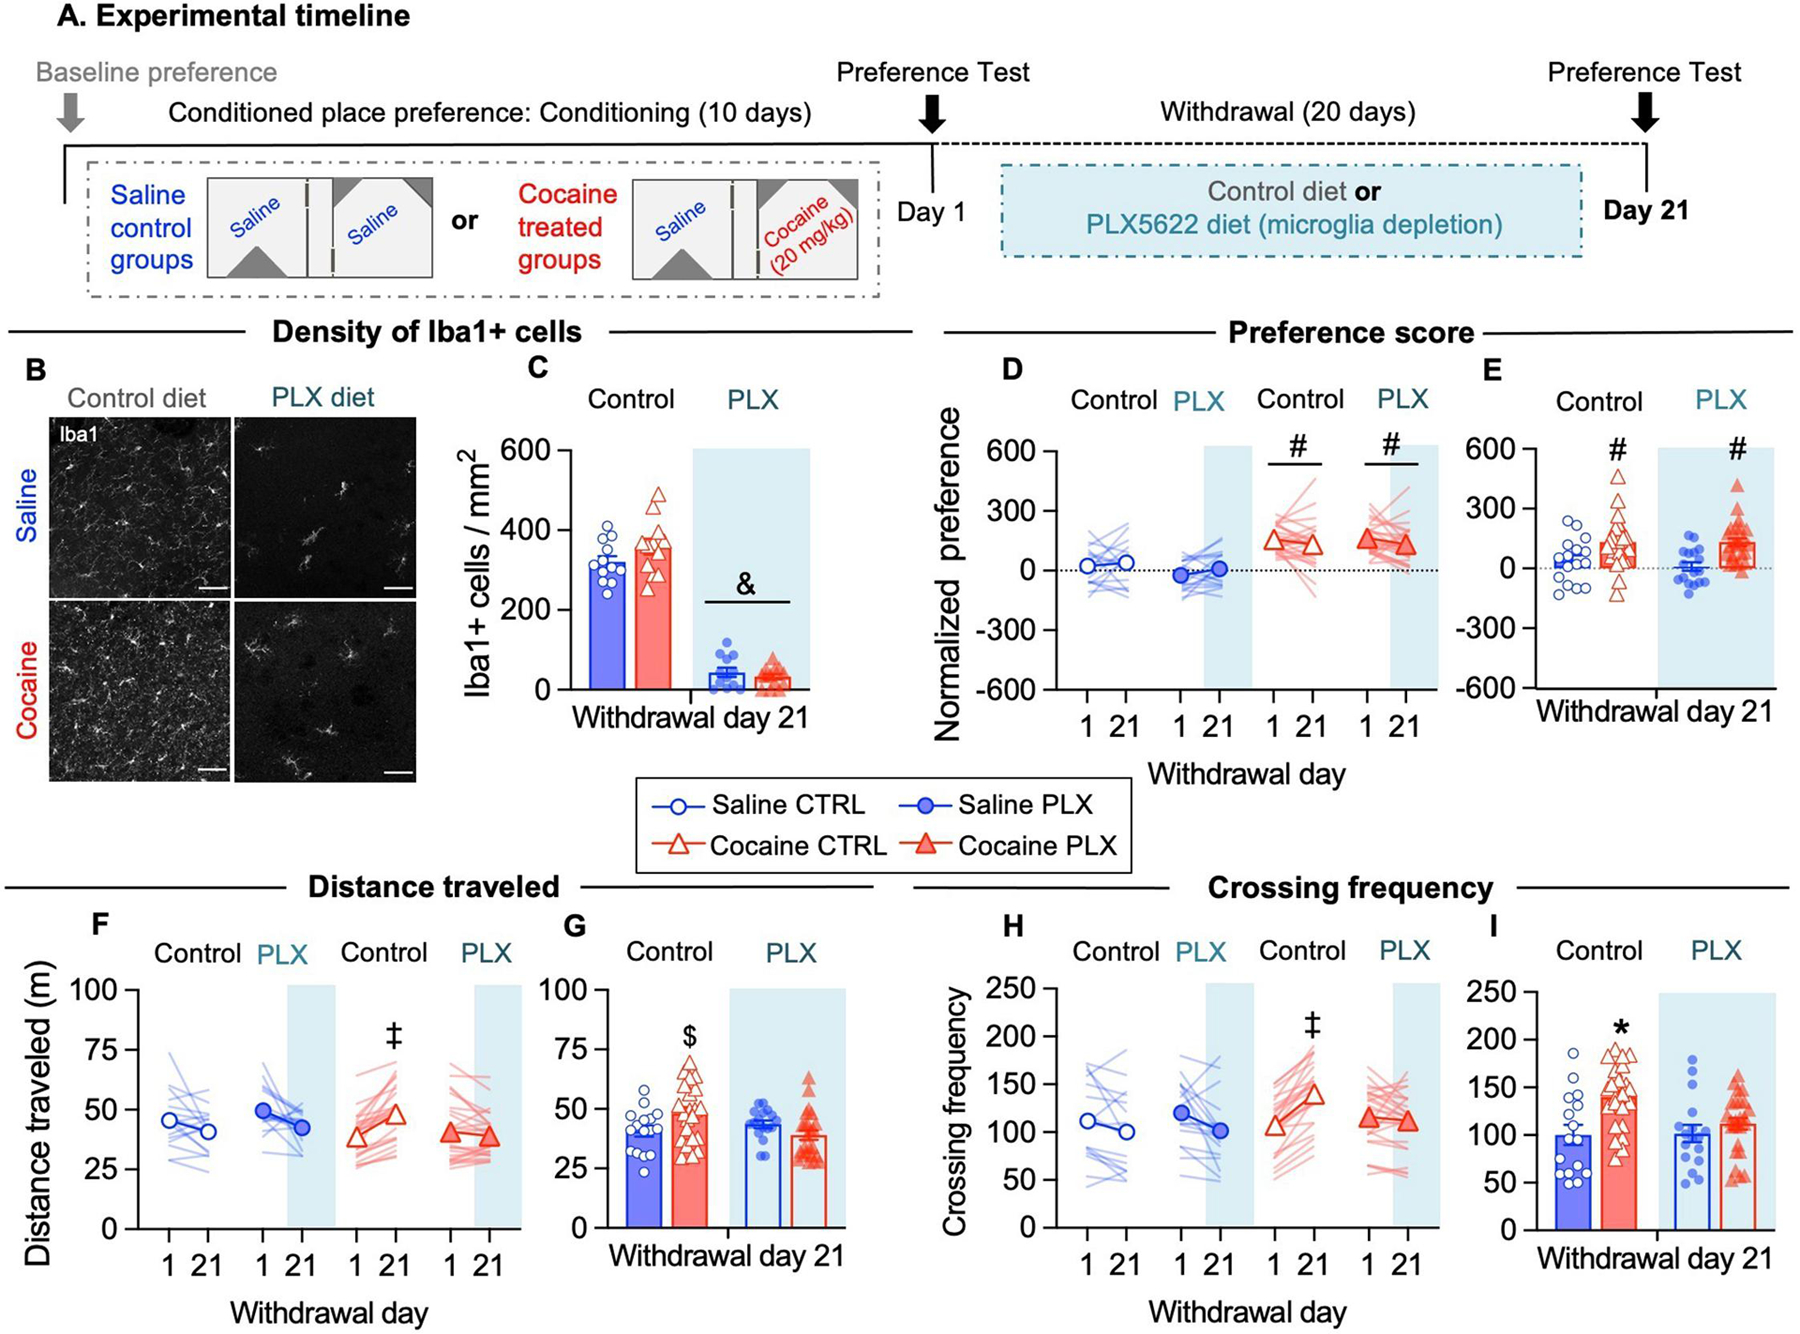
Figure 1. Microglia depletion during cocaine withdrawal prevents conditioned hyperlocomotion without affecting conditioned place preference memory.

(A) Schematic of the protocol schedule for cocaine induced CPP training, testing and microglia depletion during withdrawal. (B) Representative images of Iba1+ immunofluorescence labeling in the NAc shell at WD21 under the indicated conditions. Nuclei were counterstained with DAPI (not shown). (C) The density of Iba1+ cells was significantly reduced in both saline- and cocaine- treated mice after 20 days of PLX5622 supplemented diet (Diet: F(1, 45) = 465.0, p<0.05; N=12 fields/4 mice per group). (D) Place preference score was higher in cocaine-treated mice than saline-treated mice both at WD1 and at WD21 (Drug: F(1, 77) = 56.95, p<0.05) independently of PLX5622 treatment. (E) Place preference score at WD21 time point (Drug: F(1, 77) = 20.07, p<0.05). (F) The distance traveled in the apparatus during tests increases from WD1 to WD21 in cocaine control mice (interaction Drug x Diet x WD: F(1, 77) = 4.960, p<0.05). (G) Distance traveled during test at WD21 time point (interaction Drug x Diet: F(1, 77) = 5,456, p<0.05). (H) The frequency of crossings to side-chambers increases from WD1 to WD21 in cocaine control mice (interaction Drug x Diet x WD: F(1, 77) = 7.785, p<0.05). (I) Crossing frequency during the test at WD21 time point (interaction Drug x Diet: F(1, 77) = 4.297, p<0.05). For convenience, behavioral data from mice in the first behavioral experiment and subsequent experiments (Fig.2) are pooled together (saline control N=16 mice, saline PLX N=17 mice, cocaine control N=23 mice, cocaine PLX N=25 mice). Data are presented as mean ± SEM. Scale bars = 50 μm. The symbols indicate, & p<0.05 compared to control diet, # p<0.05 compared to saline, ‡ p<0.05 cocaine control WD1 vs cocaine control WD21, * p<0.05 compared to saline control, saline PLX and cocaine PLX, $ p<0.05 compared to cocaine PLX, by using Tukey’s test for multiple comparisons).
