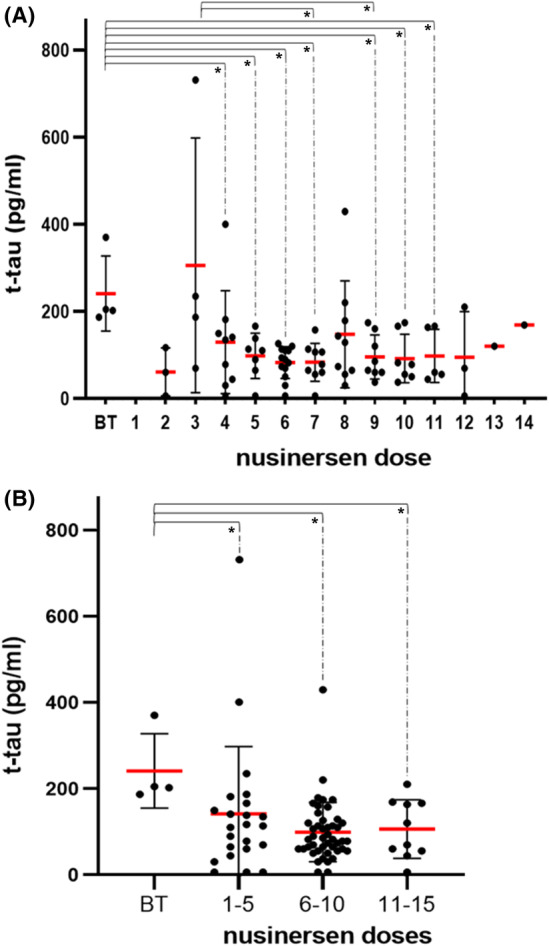
FIGURE 1.

(A) Concentrations of t‐tau protein in patients with SMA 1, SMA 2, and SMA 3 who received different doses of nusinersen. B. Levels of t‐tau protein after grouping the patients with SMA 1, SMA 2, and SMA 3 according to the number of doses received. Each patient is represented by a dot on the graph. The red horizontal line represents the mean value, while the black horizontal lines represent the standard deviation. *p < 0.05
