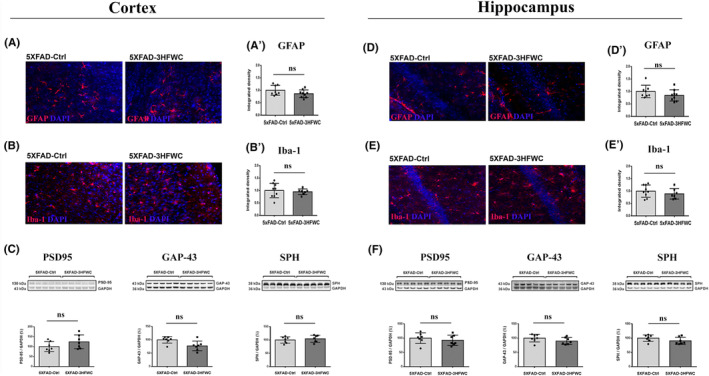
FIGURE 1.

3HFWC treatment did not incite the inflammation or synaptic vulnerability in the cortex and hippocampus of 4‐month‐old 5XFAD female mice. Representative images of GFAP, red, (A, D) and Iba‐1, red, (B, E) staining in the cortex (left) and hippocampus (right) of 5XFAD‐Ctrl and 5XFAD‐3HFWC mice. On all micrographs, DAPI staining is blue. Quantification of GFAP‐positive (A′, D′) and Iba‐1‐positive (B′, E′) staining in the cortex and hippocampus of 5XFAD‐Ctrl and 5XFAD‐3HFWC mice. Scale bar = 25 μm. Immunoblot analysis of PSD‐95 (left plot), GAP‐43 (middle plot), and SPH expression (right plot) in the cortex (C) and hippocampus (F) of 5XFAD‐Ctrl and 5XFAD‐3HFWC mice. Representative immunoblots are shown above the graphs. Relative protein abundances are obtained by normalization relative to GAPDH protein level. Data are shown as mean ± SD (n = 7 mice per group). Statistical significance analyzed by one‐way ANOVA.
