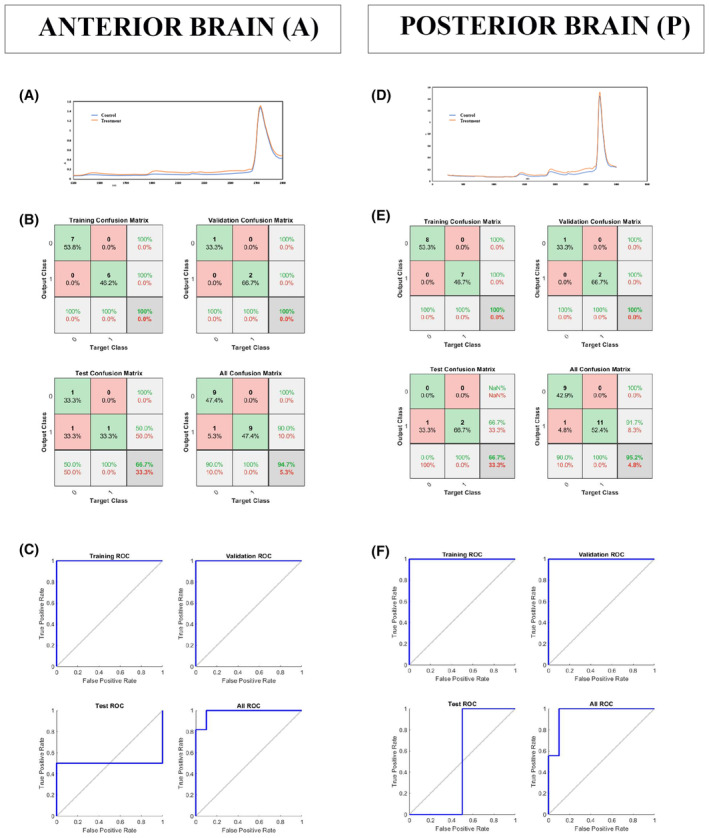
FIGURE 2.

NIRS analyses and confusion matrices. Averaged NIR spectrum for control and treatment samples from anterior (A) and posterior (D) brain (n = 10 per group). Confusion matrices from anterior (B) and posterior (E) brain. Green squares represent correct predictions; red ones represent the incorrect ones. The samples from the anterior brain have 94.7% correct prediction and 5.3% incorrect prediction; the samples from the posterior brain have 95.2% correct prediction and 4.8% incorrect prediction. The analyses of ROC curves (colored lines) in the anterior (C) and posterior (F) brain samples showed that they have the value of 0.95 each.
