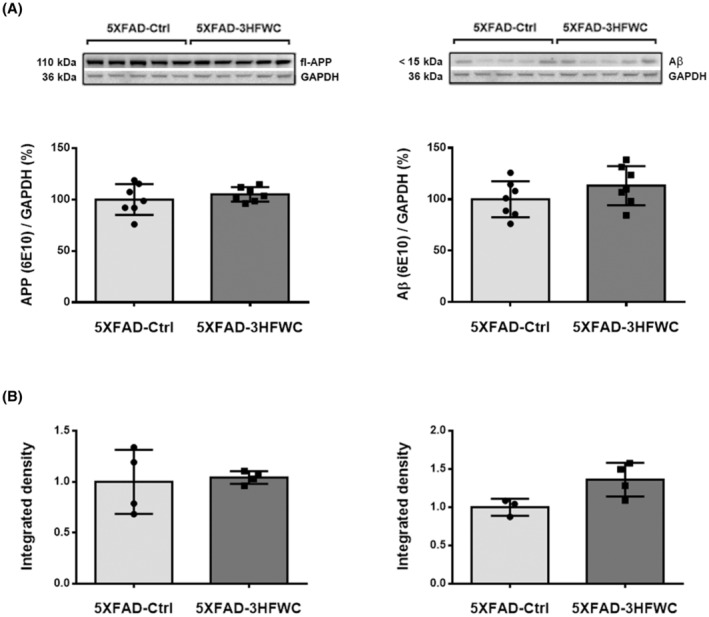
FIGURE 5.

The effect of 3HFWC treatment on APP and Aβ expression in the cortex of 5XFAD mice. (A) Immunoblot analysis of hAPP (left) and hAβ (right plot), detected by 6E10 antibody, in the cortex of 5XFAD‐Ctrl and 5XFAD‐3HFWC mice. Relative protein abundances are obtained by normalization relative to GAPDH protein level. Representative immunoblots are shown above the graphs. (B) Quantification of hAPP/Aβ‐immunostaining in the somatosensory (left) and retrosplenial cortex (right plot) of 5XFAD‐Ctrl and 5XFAD‐3HFWC mice. Data are shown as mean ± SD (n = 7 and 4 mice per group for WB and IHH analysis, respectively). Statistical significance analyzed by one‐way ANOVA.
