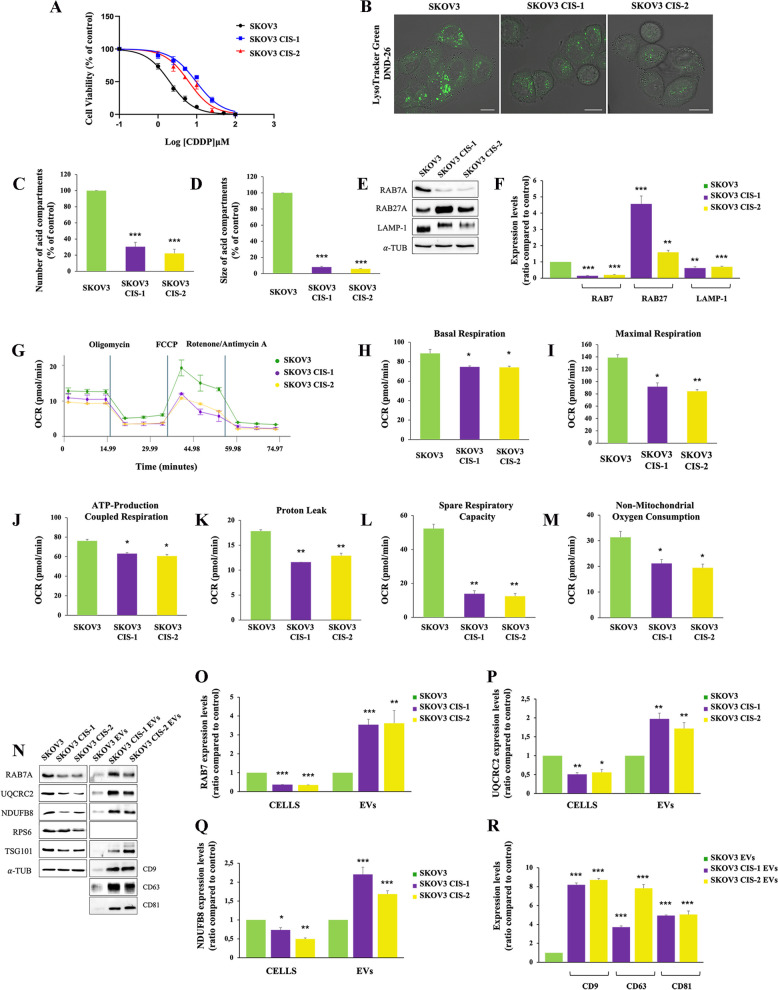
Fig. 10.
Analysis of mitochondrial and lysosomal deficit and EVs in SKOV-3 sensitive and resistant cells. A EC50 was determined in SKOV-3, SKOV-3 CIS-1, and SKOV-3 CIS-2 after 72 h of treatment with CDDP using the MTT(3-(4,5-dimethylthiazol-2-yl)-2,5-diphenol tetrazolium bromide) assay. B Late endocytic acid compartments were live stained with LysoTracker DND-26 dye and images were acquired with confocal microscopy. C, D The number and size of LysoTracker-positive organelles were determined by ImageJ software. E, F Relative protein abundance of RAB7, RAB27, and LAMP-1 was assessed by Western blot analysis and quantified by densitometry normalizing against α-Tubulin. G Oxygen rate consumption (OCR) was determined in SKOV-3 and in SKOV-3 CIS-1 and CI-2 with Seahorse Mito stress kit assay. H-M Basal respiration, maximal respiration, ATP-production coupled respiration, proton leak, and spare respiration capacity were determined by Seahorse data elaboration. N-R EVs were purified by immunoisolation. Positive and negative controls were used to verify the purity of EVs. Mitochondrial protein expression was evaluated in EVs by Western blot and the relative abundance of RAB7, UQCRC2, NDUFB8, and three tetraspanins (CD9, CD63, and CD81) was determined through densitometric analysis normalizing against α-Tubulin.* p < 0.05; ** p < 0.01; ***p < 0.001. Scale bar = 10 μm

