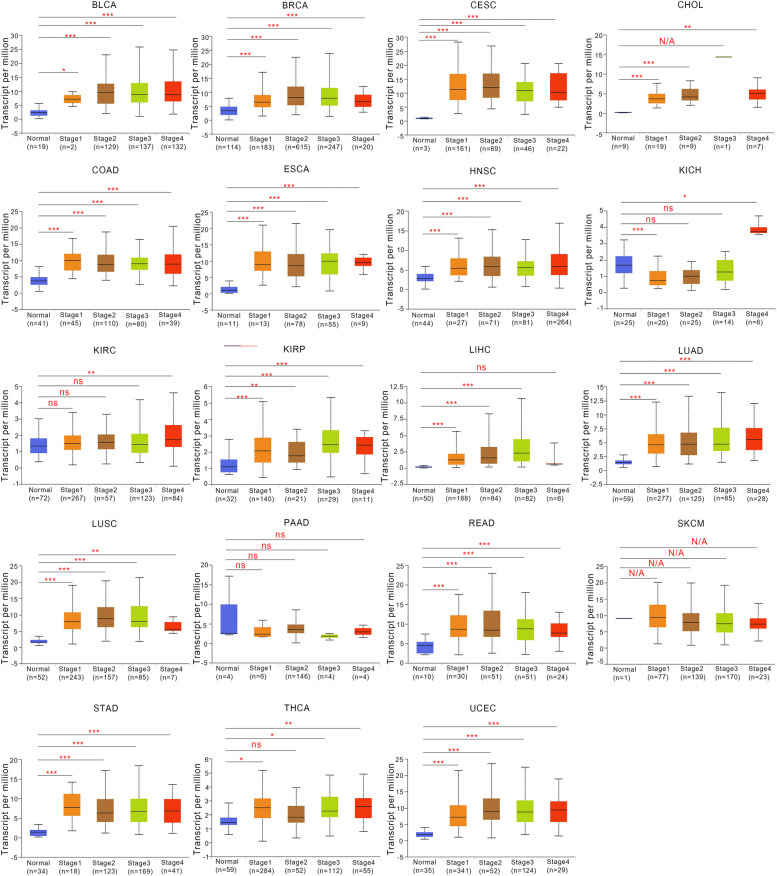
Fig. 2.
Correlations between FANCD2 gene expression and the main pathological stages of BLCA, BRCA, CESC, CHOL, COAD, ESCA, HNSC, KICH, KIRC, KIRP, LIHC, LUAD, LUSC, PAAD, READ, SKCM, STAD, THCA, and UCEC based on the TCGA dataset. *P < 0.05, **P < 0.01, ***P < 0.001, ns No significance, and N/A not applicable

