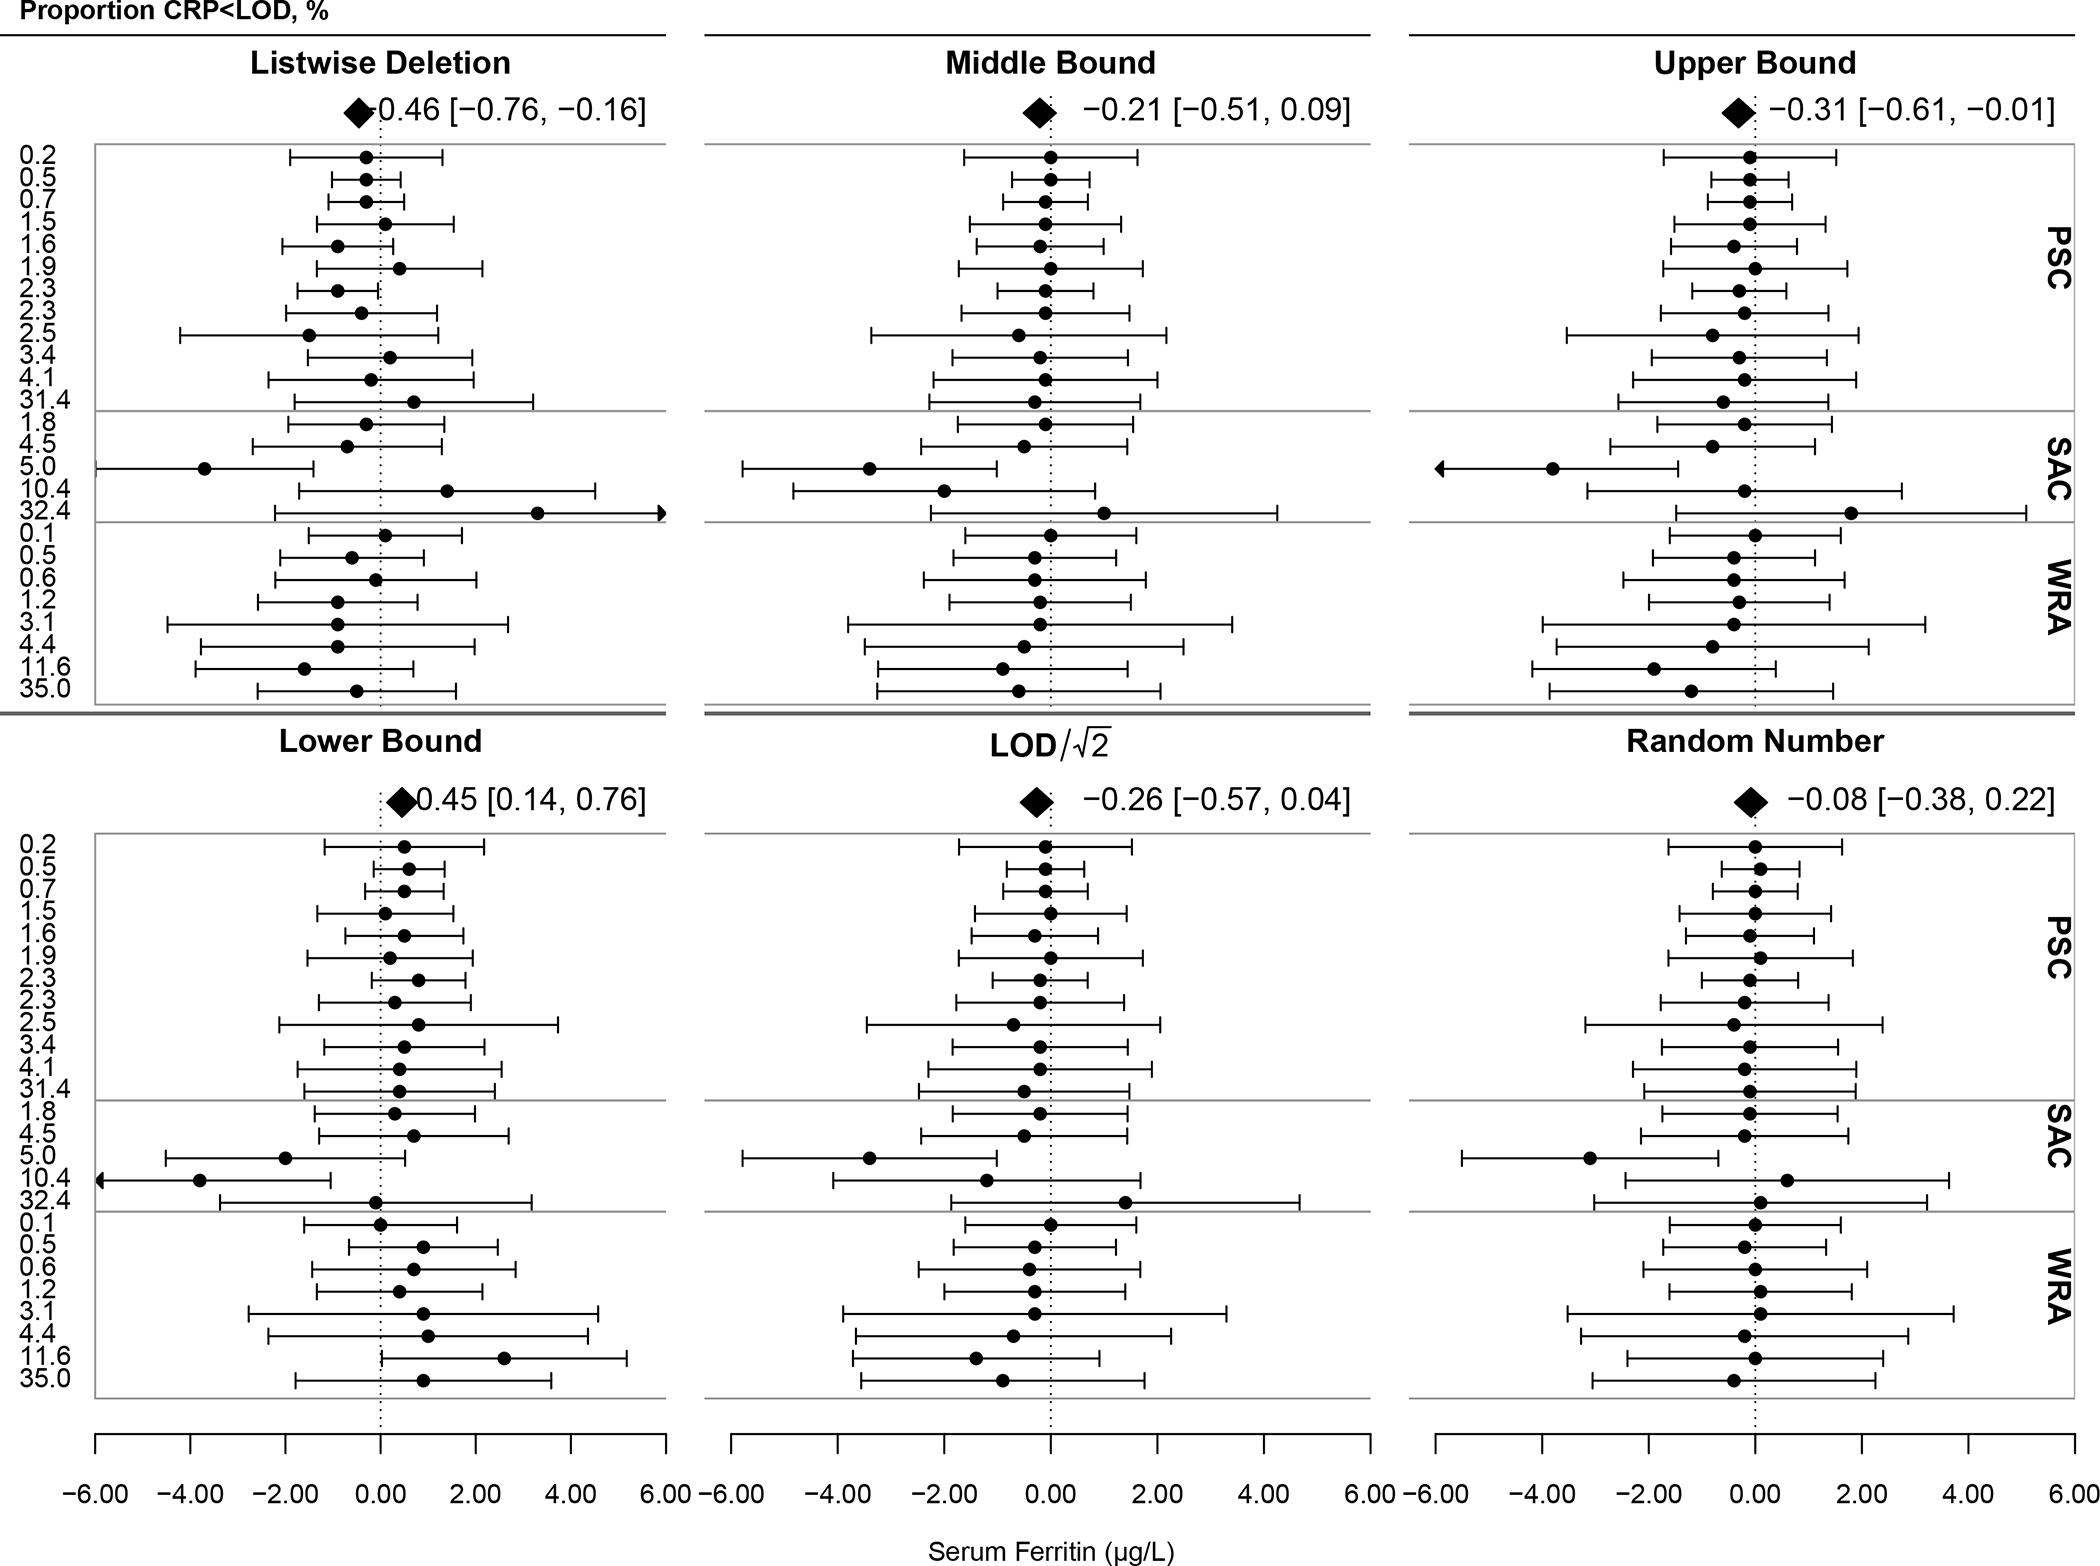
Figure 1: Deviance and Reliability of Inflammation-Adjusted Mean Serum Ferritin Concentration under Differing Analytic Approaches for C-reactive Protein (CRP) Less Than the Limit of Detection (LOD) Within 29 Surveys Across 7 Countries (n=33,053).

LOD for CRP=0.05 mg/L. The dotted reference line at 0 indicates the estimated mean serum ferritin adjusted for inflammation using multiple imputation within each survey and population group. Points and error bars represent the deviance of each approach from the multiple imputation estimate within each survey and population group with 95% confidence intervals. The polygon represents the mean deviance of all surveys using the labelled approach. Test for differences by analytic approach (subgroup differences): QM=20.19, df=5, p<.001.
