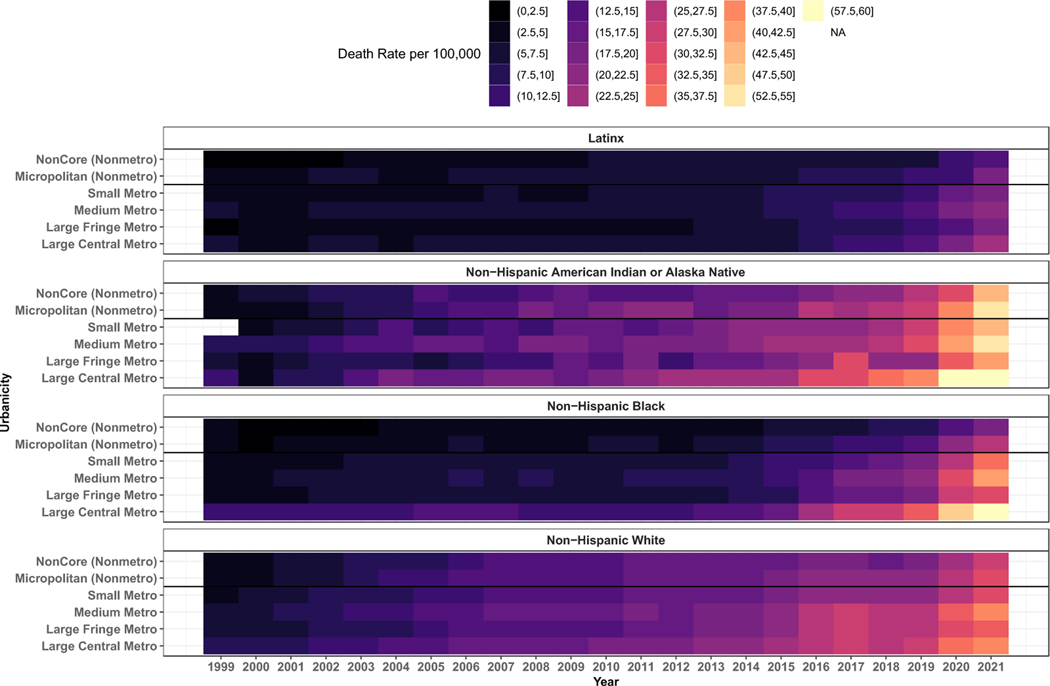
Figure 2 : Drug overdose mortality per 100,000 people by race/ethnicity and type of drug involved, 1999–2021.
Drug overdose mortality definitions are described in figure 1 caption. Race and ethnicity were used as defined in the WONDER and NCHS databases. Racial and ethnic groups were defined first by ethnicity (Hispanic or Latino) and subsequently by race (non-Hispanic American Indian or Alaska Native, non-Hispanic Black, and non-Hispanic White). This figure highlights that during the study period, overdose increased significantly and at rates that were more impacted by race/ethnicity than by level of urbanicity. All urban and rural-designated counties showed worsening rates of overdose in each racial/ethnic category between the years 1999–2021.

