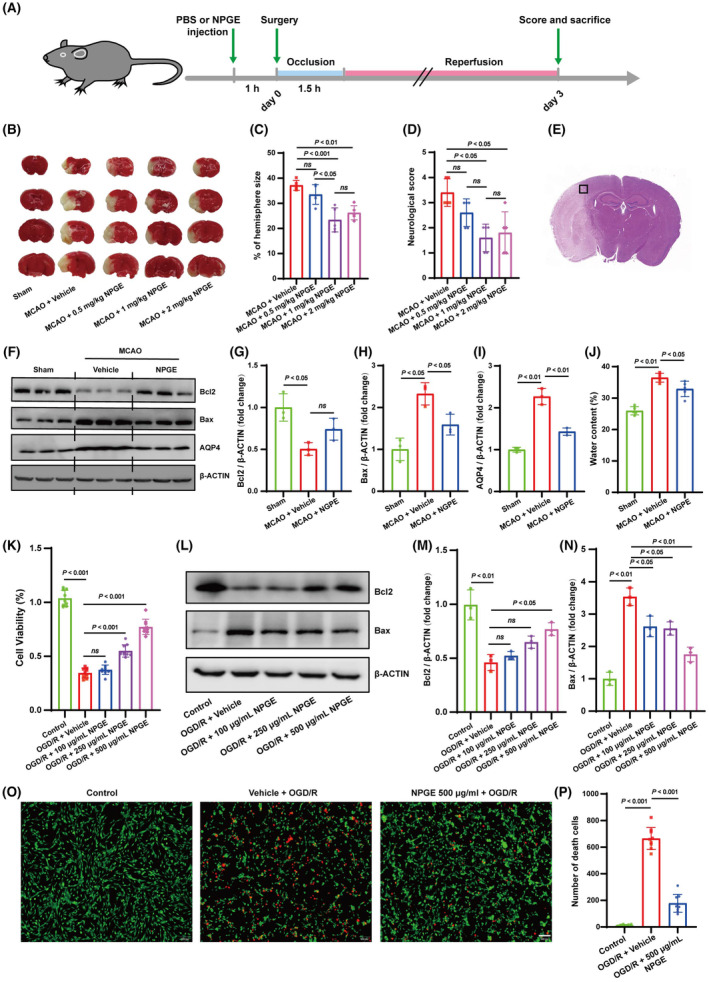
FIGURE 1.

NPGE treatment alleviated I/R injury. (A) Schematic for the experimental protocol used in mice. (B, C) TTC stained brain slices showing infarct volume (white), and the infarct volume was measured in the mice treated with PBS or NPGE (0.5, 1 and 2 mg/kg) after CIRI, n = 5. (D) Neurological scores, n = 5. (E) Schematic representation of the ischemic penumbra. (F–I) Western blotting analysis of Bcl2, Bax and AQP4 in ischemic penumbra region after CIRI, n = 3. (J) Quantification of water content, n = 5. (K) Cell viability of OGD/R–induced HT22 cells treated with NPGE (0, 100, 250, 500 μg/mL), n = 3. (L–N) Western blotting analysis of Bcl2 and Bax in HT22 cells, n = 3. (O, P) Calcein–AM/PI staining of HT22 cells. Calcein–AM (green), PI (red), n = 3, scale bar 50 μm. ns, no significance.
