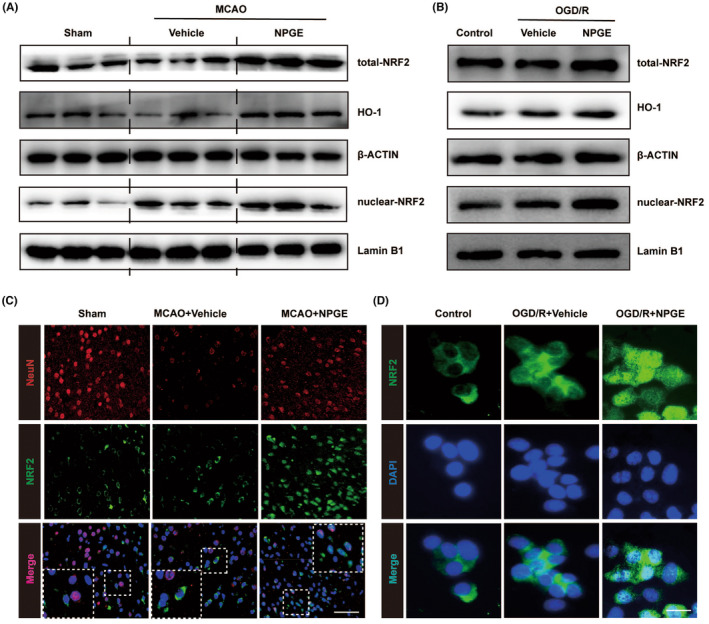
FIGURE 5.

NPGE treatment activated NRF2/HO–1 signaling pathway after I/R injury. (A) Western blotting analysis of total–NRF2, HO–1 and nuclear–NRF2 in the ischemic penumbra tissue after CIRI, n = 6. (B) Western blot analysis of total–NRF2, HO–1 and nuclear–NRF2 in HT22 cells after OGD/R, n = 3. (C) Representative immunofluorescence images of NeuN–positive cells and NRF2–positive cells in the ischemic penumbra tissue after CIRI, n = 5, scale 40 μm. (D) Representative immunofluorescence images of NRF2 in HT22 cells, n = 5, scale 10 μm. *p < 0.05, **p < 0.01, ***p < 0.001.
