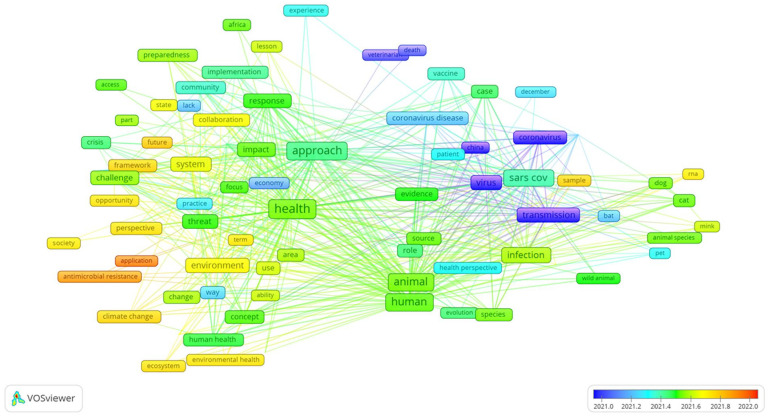
Figure 10.
Mapping term co-occurrence over time: a visual representation of term frequency in titles and abstracts of One Health-COVID-19-related publications (Binary counting: involves assessing the presence or absence of a term in the titles and abstracts of documents, with the frequency of occurrences within a document being disregarded). The blue nodes represent earlier occurrences, and the red nodes represent later occurrences. The map was created using VOSviewer software version 1.6.19.

