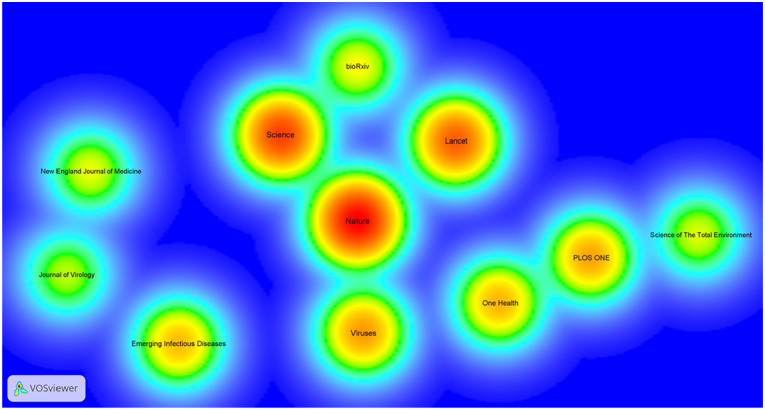
Figure 7.
Density visualization map of co-citation of cited sources. The minimum number of citations of a source was set as 100. Full counting is employed, where each co-citation link is assigned equal weight. Of the 8347 sources, 11 met the threshold. For each of the 11 sources, the total strength of the co-citation links with other sources was calculated. The sources with the greatest total links strength were selected. The red color corresponds with the highest item density and blue corresponds with the lowest item density. The map was created using VOSviewer software version 1.6.19.

