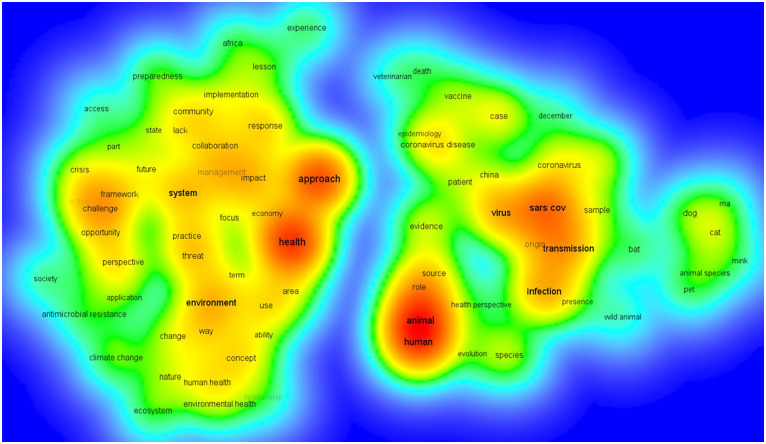
Figure 9.
The density visualization map of terms co-occurrence in titles and abstracts of One Health-COVID-19-related publications. Twenty occurrences of a term were set as the minimum number (Binary counting: involves assessing the presence or absence of a term in the titles and abstracts of documents, with the frequency of occurrences within a document being disregarded). The red color indicates the most frequently occurring terms, corresponding to the highest item density, while blue represents the lowest item density. The map was created using VOSviewer software version 1.6.19.

