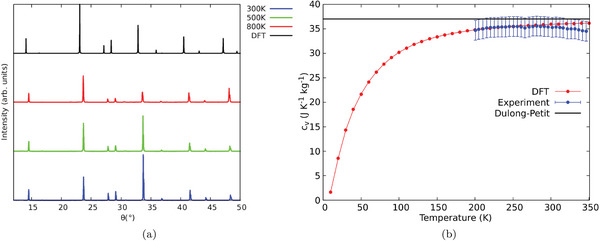
Figure 2.

a) DFT calculated (black line) and experimental X‐ray diffraction pattern of Cs2NaYbCl6 at 300 K (blue line), 500 K (green line), and 800 K (red line). b) Calculated (red) versus measured (blue) specific heat capacity: the black line represents the Dulong–Petit limit.
