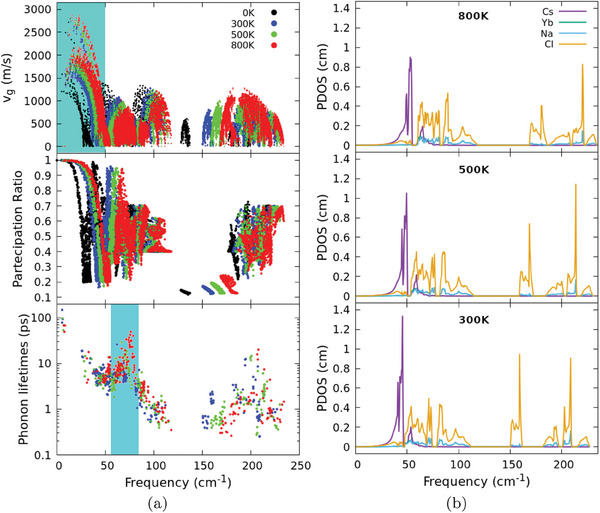
Figure 6.

a) Phonon group velocity spectrum (top panel), participation ratio (middle panel), and phonon lifetimes (bottom panel) of Cs2NaYbCl6 at 0 K (black) and for the three finite temperatures here investigated, namely 300 K (blue), 500 K (green), and 800 K (red). Cyan regions evidence the frequency ranges where anomalous increases of phonon group velocities and lifetimes are more evident. b) Projected atomic‐phonon density of states (PDOS) at 300, 500, and 800~K. The dominant role of Cs‐ and Cl‐atoms in determining vibrational properties is evidenced as well as the dominant role of Cs‐atoms in low frequency region.
