Figure 4.

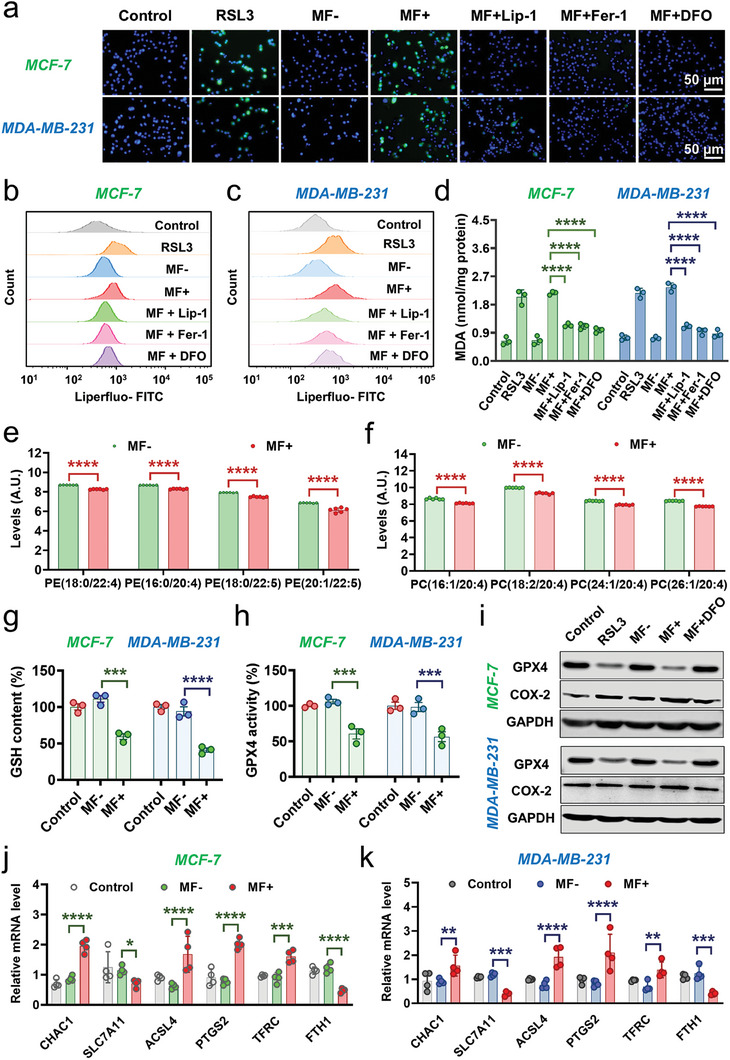
Iron‐driven oxidative damage and antioxidant defense imbalance via T7‐MNTs. a) Fluorescence images of intracellular ROS level in MCF‐7 and MDA‐MB‐231 cells measured by DCFH‐DA staining. RSL3 group was treated with RSL3 (20 µM) for 24 h. The “MF+” group was treated with T7‐MNTs and followed by MF application (260 mT, 15 Hz, 30 min). “MF+Lip‐1″, “MF+Fer‐1″, and “MF+DFO” groups were incubated with Lip‐1 (1 µm), Fer‐1 (5 µm), and DFO (50 µm) for 6 h before MF application. The cells incubated with T7‐MNTs were used as the “MF‐” group, and untreated cells were used as the control group. (scale bar: 50 µm). b,c) Flow cytometry results of LPO level in MCF‐7 (b) and MDA‐MB‐231 cells (c) after different treatments. d) MDA content of MCF‐7 and MDA‐MB‐231 cells with various conditions (n = 3, ****p < 0.0001). e) Levels of PEs in the MF‐ and MF+ groups (n = 6, ****p < 0.0001). f) Levels of PCs in the MF‐ and MF+ groups (n = 6, ****p < 0.0001). g) Intracellular GSH level of MCF‐7 and MDA‐MB‐231 cells (n = 3, ****p < 0.0001, ***p < 0.001). h) Intracellular GPX4 activity of MCF‐7 and MDA‐MB‐231 cells (n = 3, ***p < 0.001). i) Western blotting assay of the GPX4 protein and COX‐2 protein expression after different treatments in MCF‐7 and MDA‐MB‐231 cells, respectively. j–k) The mRNA expression level of CHAC1, SLC7A11, ACSL4, PTGS2, TFRC, and FTH1 with different treatment in MCF‐7 j) and MDA‐MB‐231 cells k). (n = 4, ****p < 0.0001, ***p < 0.001, **p < 0.01, *p < 0.05).
