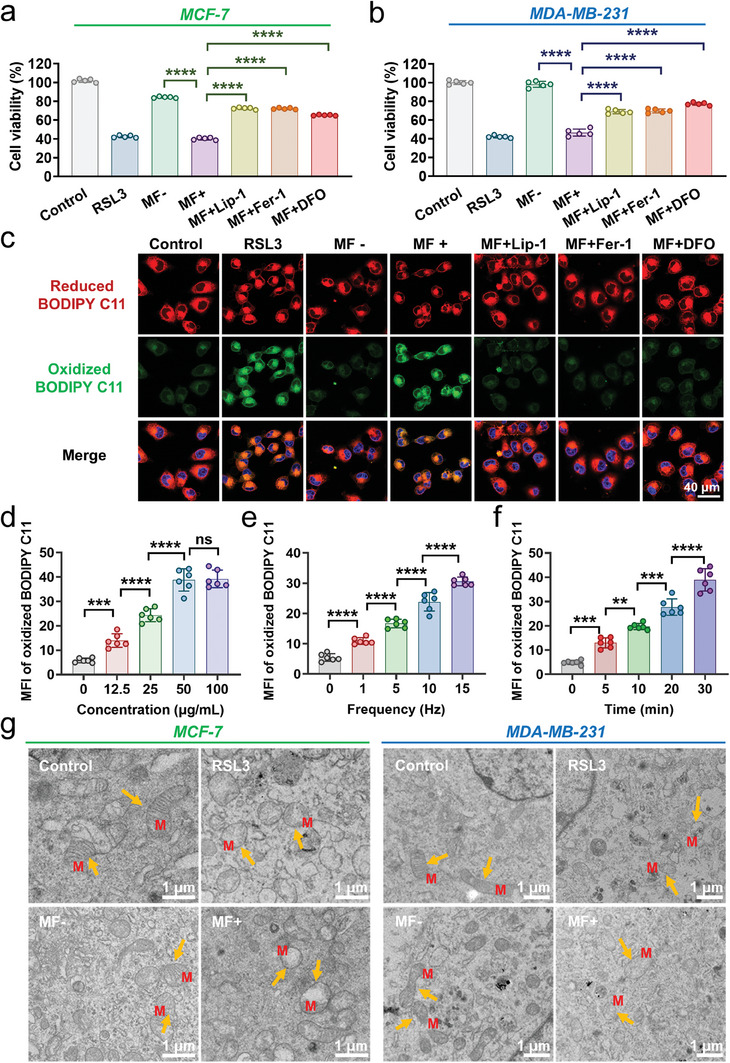
Figure 5.

T7‐MNT‐mediated ferroptosis in cancer cells. a,b) Cell viability of MCF‐7 a) and MDA‐MB‐231 cells b) with different treatments (n = 5, ****p < 0.0001). The “MF+” group was treated with MF (260 mT, 15 Hz) for 30 min. “MF+Lip‐1″, “MF+Fer‐1″, and “MF+DFO” groups were respectively pre‐treated with Lip‐1 (1 µm), Fer‐1 (5 µm), and DFO (50 µm) for 6 h before MF. The cells incubated with T7‐MNTs were used as the “MF‐” group, and untreated cells were used as the control group. c) Confocal images of lipid peroxidation in MCF‐7 cells after different treatments. 20 µm of RSL3 was used as a positive control (scale bar: 40 µm). d) Quantitative analysis of oxidized BODIPY C11 in MCF‐7 cells treated with different concentrations of T7‐MNTs (Fe = 0, 12.5, 25, 50, 100 µg mL−1). The frequency of MF was 15 Hz and the treatment time was 30 min. e) Quantitative analysis of oxidized BODIPY C11 in MCF‐7 cells treated with different frequencies of MF. The concentration of T7‐MNTs was 50 µg mL−1 and the treatment time of MF application was 30 min. f) Quantitative analysis of oxidized BODIPY C11 in MCF‐7 cells treated with different treatment periods. The concentration of T7‐MNTs was 50 µg mL−1, and the frequency of the MF was 15 Hz. (n = 6, ****p < 0.0001, ***p < 0.001, **p < 0.01, ns: no significance). g) Typical bio‐TEM images of MCF‐7 and MDA‐MB‐231 cells with different treatments. Yellow arrows noted the representative morphology of mitochondria. M represented mitochondria (scale bar: 1 µm).
