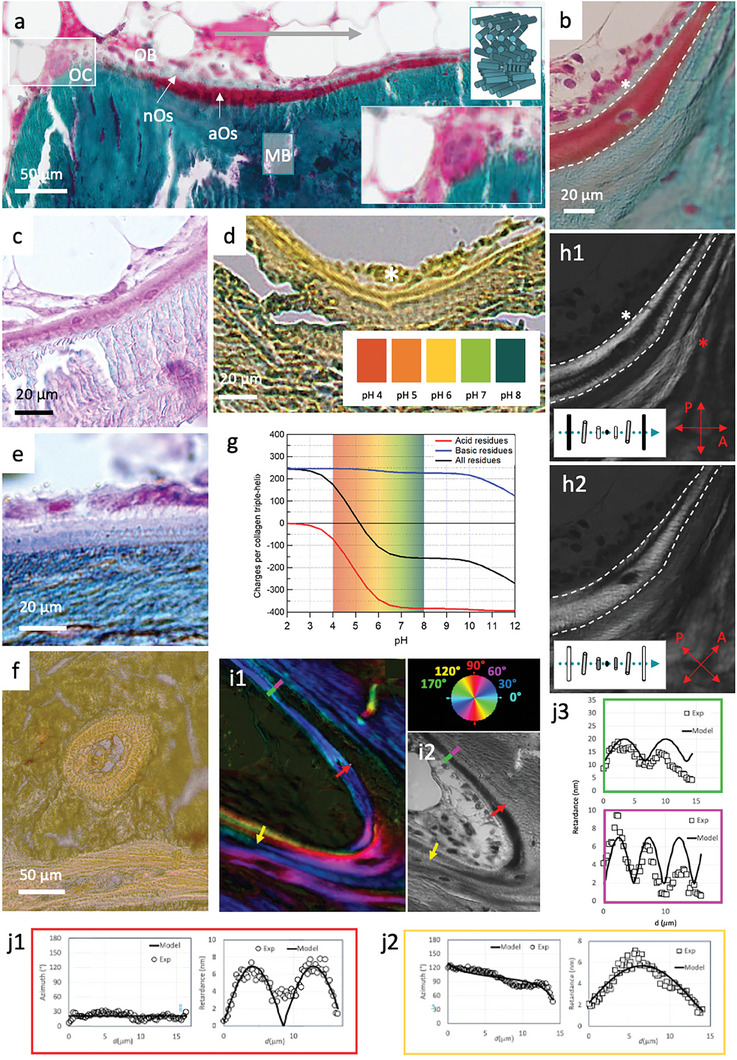
Figure 1.

Acidic osteoid texture and composition by optical microscopies. Light microscopy overview a) of bone histological sections stained with Goldner trichrome. Acidic osteoid tissue (aOs), osteoclasts (OC), and osteoblasts (OB) nuclei are stained in deep red. Collagen fibrils in mature bone (MB) and in neutral osteoid (nOs) are stained in blue/green. A schematic representation of the mineralized collagen fibrils arrangement (in a twisted plywood model) is shown in the upper inset. The white marked rectangle is enlarged in the lower inset. b) Similar staining of a magnified bone region showing aOs (between the white dashed lines) and nOs (white *). Additional bone components are visible in bone histological sections colored with c), basic fuchsin staining, d), a universal pH indicator essay observed by DIC which reveals the presence of glycosaminoglycans and a lower pH in aOs compared to the surrounding nOs and MB tissues, and e), Alcian blue/Ziehl fuchsin double‐stain reveals acidic glycosaminoglycans (violet) in the aOs. f), Histological thin section of compact bone colored with a universal pH indicator essay (color chart in d), observed by DIC. g), calculated charge per collagen triple‐helix plotted as a function of pH. Collagen molecules are slightly negative in the range of pH 5–6. h) polarization images of (b). Comparison between light (b) and polarized light h1,h2) observations demonstrates the absence of birefringence in the nOs and reveals the presence of thin alternating bright and dark bands in the aOs and in the immediately adjacent MB (red *). The schematic represents the resulting intensity of transmitted light when the optical axis lies between the crossed polarizers at 0° (h1) and 45° (h2). The blue dotted line denotes the helical axis. i) Histological section showing twisted plywood motifs in MB and aOs by quantitative LC‐polscope, and observed i2), by light microscope. j1,j2) Retardance and Azimuth of the birefringence quantified on the red and yellow arrows, respectively thanks to the axis orientation (color wheel). A cholesteric model (see text and Experimental Section) well fits the experimental measurements. j3) Retardance of the birefringence quantified on the green (aOs) and violet (MB) lines which are continuous.
