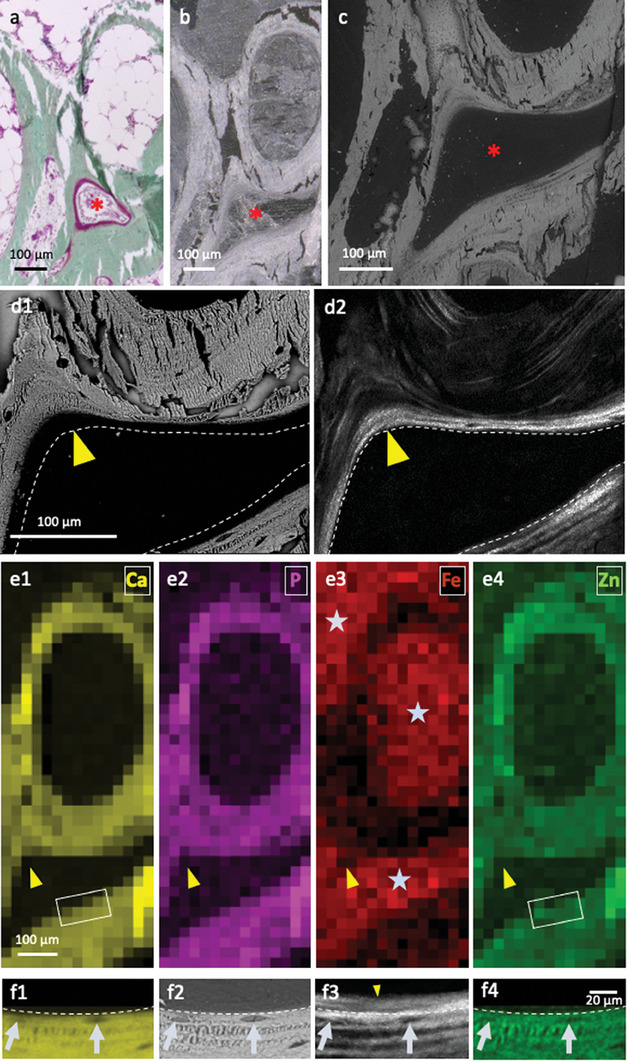
Figure 5.

Identification of domains in interest on subsequent sections and different techniques, mineralized collagen and elemental mapping at moderate and high resolution. Observations by light microscopy of a histological thin section stained with Goldner trichrome a); the unstained subsequent thin section observed by PLM b) and backscatter SEM c). The red star (*) shows the same area. d1) Backscatter SEM and d2) SHG maps of the same region in a histological thin section of bone reveals the spatial relationship between lamellae and aOs leading to new bone formation (yellow arrowheads). Dashed line in panels b and a placed as a guide to the eye for direct comparison and interpretation of the different imaging contrasts. e) XRF spectra, matching panels including areas (d1) and (d2) (yellow arrowheads), provide complementary contrasts of the distributions of calcium (Ca), phosphorus (P), iron (Fe), and zinc (Zn). Note that Fe is found exclusively in bone marrow (grey stars) whereas Zn, despite its low density, closely matches the distributions of apatite mineral (Ca, P). f) Comparative imaging of the inset marked in e1,e4) by EDX f1, f4), backscattered SEM f2) and SHG f3). The chemical mapping of Ca (f1) matches the backscattered signal (f2) and the signal from Zn (f4) with osteocytes visibly embedded in the mineralized lamellae. The same cells are visible in SHG (f3) highlighting the existence of a ≈8 µm thick non‐mineralized and non‐fibrillar collagen layer of aOs juxtaposed on the bone.
