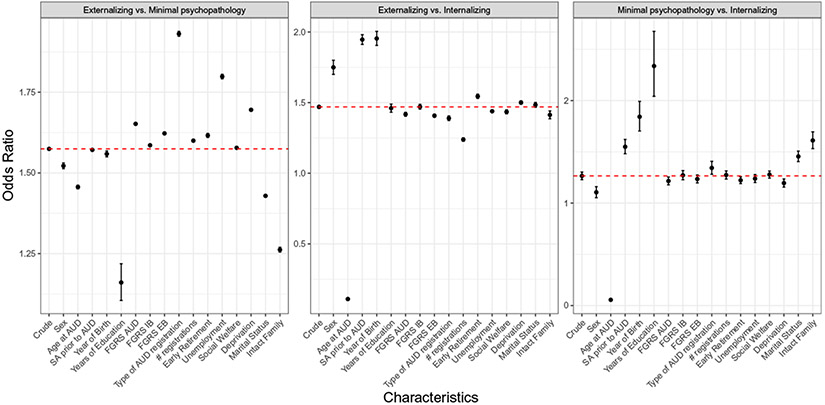
FIGURE 2.
Risk of suicide death across alcohol use disorder (AUD) typologies. The y-axes depict the odds ratios for the group difference in risk for suicide death. The y-axes are on the linear scale for a better interpretation of the differences in effect sizes. The first point represents the crude association (extended by the dashed red horizontal line) and the subsequent points represent the odds ratios for the group difference controlled for a specific predictor (mentioned in the x-axes). FGRS, family genetic risk score; IB, internalizing behaviors; EB, externalizing behaviors; # registrations, number of AUD registrations; Deprivation, neighborhood deprivation.

