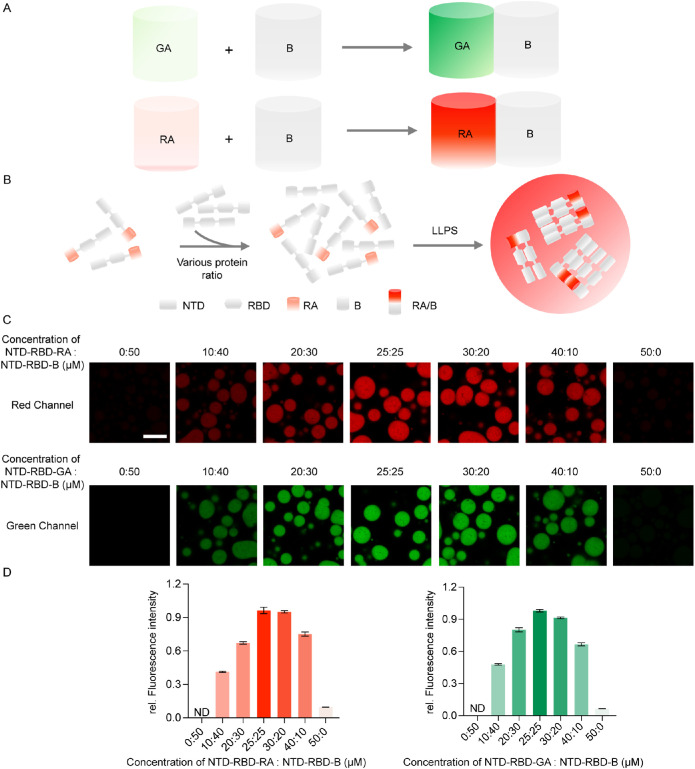
FIGURE 1.
The ddFP system can detect protein interaction during in vitro LLPS. (A) Schematic of the ddFP system. (B) The LLPS process of NTD-RBD-RA/B. (C) Fluorescent intensity is ddFP dimer concentration dependent. The total protein concentration is 50 µM, changing the ratio of NTD-RBD-RA/GA and NTD-RBD-B. Fluorescence intensity of droplets decrease with a decrease in concentration of ddFP dimer. (D) Quantification of the fluorescence intensity of the droplets in (C). LLPS of proteins is induced in 20 mM HEPES, 140 mM NaCl, 5% PEG 3350. All measurements were conducted in triplicates and error bars are calculated as standard deviations. Scale bar = 10 µm.

