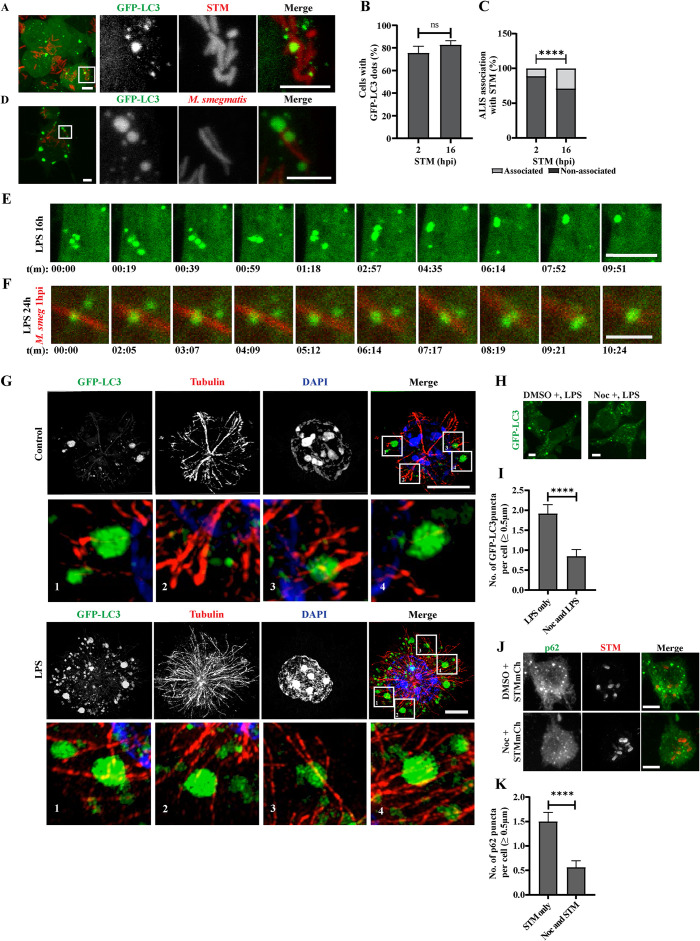
FIGURE 2:
ALIS associates with phagosomes and its assembly depends on microtubules. ALIS associates with bacteria containing phagosomes as detected in macrophage cells after stimulation with STM-mCherry (A) or M. smegmatis-mRFP (D). Inset contrast has been adjusted for better visibility. Graph represents the percentage of cells forming GFP-LC3 dots upon infection with STM (B) and fraction of total associated and non-associated number of ALIS associating with the bacteria upon infection in percentage (C). Statistical significance was calculated on pooled data from experimental replicates using Fisher’s exact test on fraction of total represented as percentage. The experiments were performed in triplicates. A minimum 150 cells were counted for each repeat.
RAW GFP-LC3 macrophages were stimulated with LPS for 16 h (E) or LPS (24 h) followed by infection with M. smegmatis mRFP for 1 h (F). Images from live cells are shown for indicated time points. LPS treated cells with fusion of GFP-LC3 puncta (Supplemental Movie 1) and localization and fusion of GFP-LC3 puncta on bacteria (Supplemental Movies 2 and 3). Occurrence of ALIS fusion is shown in the insets. ALIS association with tubulin was observed in RAW GFP-LC3 cells under control conditions or by stimulating cells with LPS for 12 h and immunostaining for tubulin (G). Inset contrast has been adjusted for better visibility. Same is shown in three-dimensional projection for control cell (Supplemental Movie 4) and LPS treated cell (Supplemental Movie 5). Representative images of RAW GFP-LC3 cells where nocodazole was added before activating the cells by LPS stimulation or STMmCh infection (H and J). Graph represents average number of GFP-LC3 (I) or p62 (K) puncta formed per cells. For microtubule destabilization experiments, statistical significance was calculated on pooled data from experimental replicates using unpaired t test. For calculating the number of puncta per cell, the experiments were performed in duplicates for both LPS and STM. A minimum 50 cells were counted for each repeat for LPS and 40 cells for STMmCh. Scale bars, 5 μm. (P) * < 0.05, (P) ** < 0.005, (P) *** < 0.0005, (P) **** < 0.0001, ns = nonsignificant. Data are represented as mean ± SEM.

