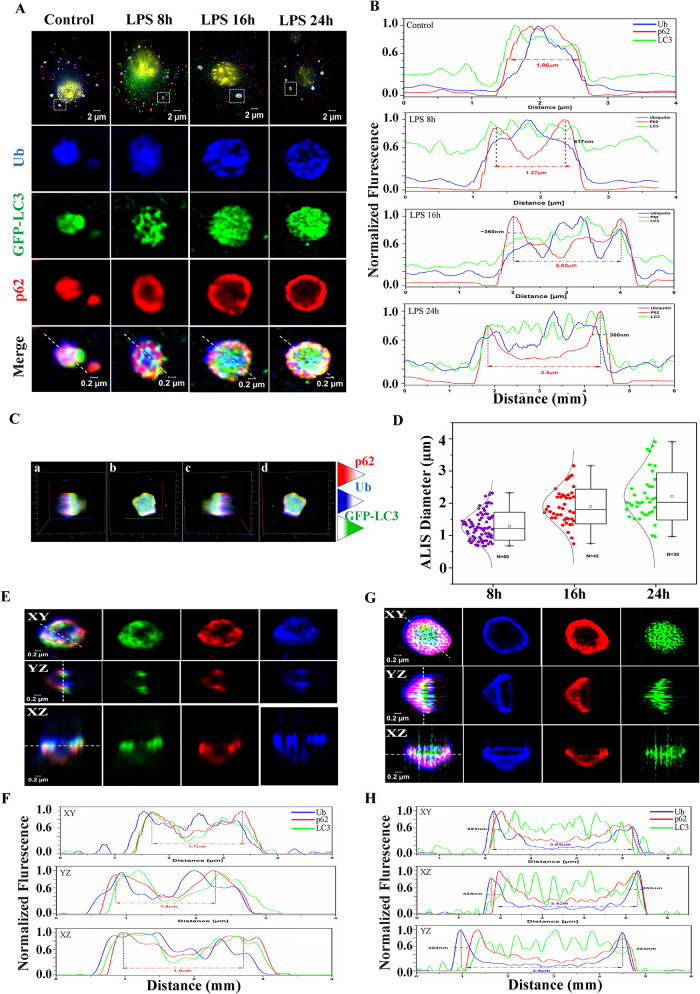
FIGURE 4:
SIM images representing: Relative positioning of the three proteins, GFP-LC3 (green), p62 (red) and ubiquitin (blue), with respect to each other in ALIS after LPS stimulation in 8, 16, and 24 h as compared with control (untreated) cells (A). Line profile analyses of ALIS at corresponding time points of LPS stimulation (B). Three-dimensional reconstitution from SIM images of a single ALIS observed after coimmunostaining for p62 and ubiquitin in RAW GFP-LC3 cells (a), structure rotated by: 90 degrees (b), 180 degrees (c) and 270 degrees (d) (C). Whisker plot showing the number of ALIS with increased diameter at 8, 16, and 24 h of LPS stimulation, a minimum of 15 cells were used in each time point (D). Two different patterns of organization of the three proteins observed in a mature ALIS (up to 24 h of LPS) along with their respective line profile analyses (E–H).

