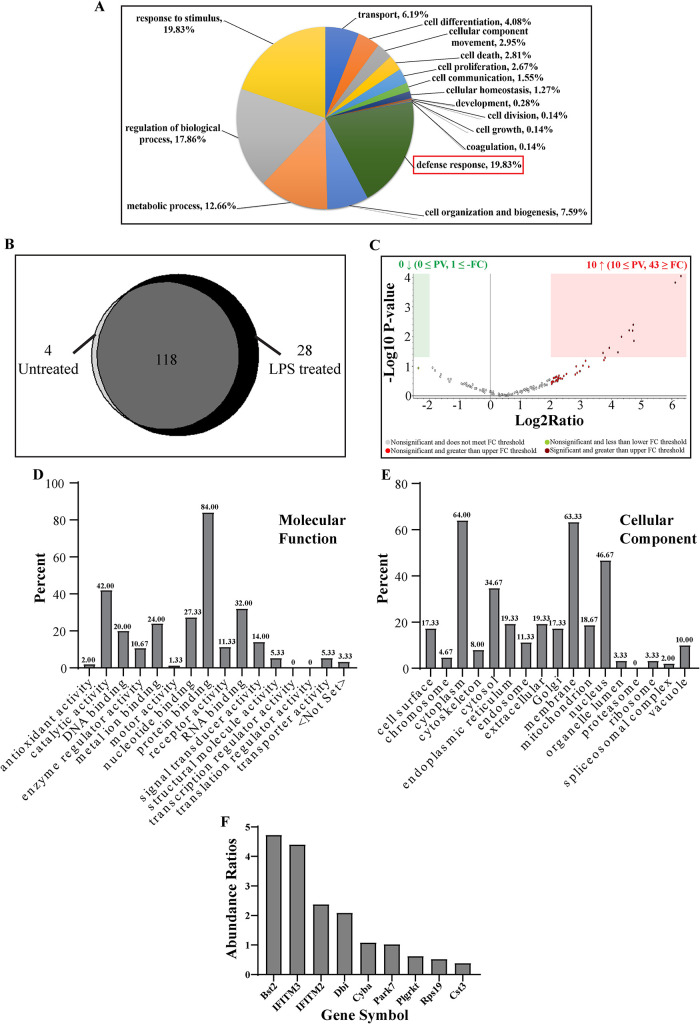
FIGURE 7:
Bioinformatics analysis of defense response proteins: Distribution of proteins from LPS treated fractions based on their biological processes (A). Venn diagram showing the distribution of proteins involved in defense response identified in unstimulated cell lysate fractions versus LPS stimulated cell lysate fractions (B). Volcano plot representing the fold change and p value in the proteins identified from LPS and control treatment groups where x-axis shows fold change and y-axis depicts p value (C). Distribution of proteins based on their molecular functions (D), and cellular components (E). Abundance ratios between proteins from LPS stimulated and unstimulated samples, with molecular masses between 15 to 20 kDa involved in defense response and with membrane binding properties (F).

