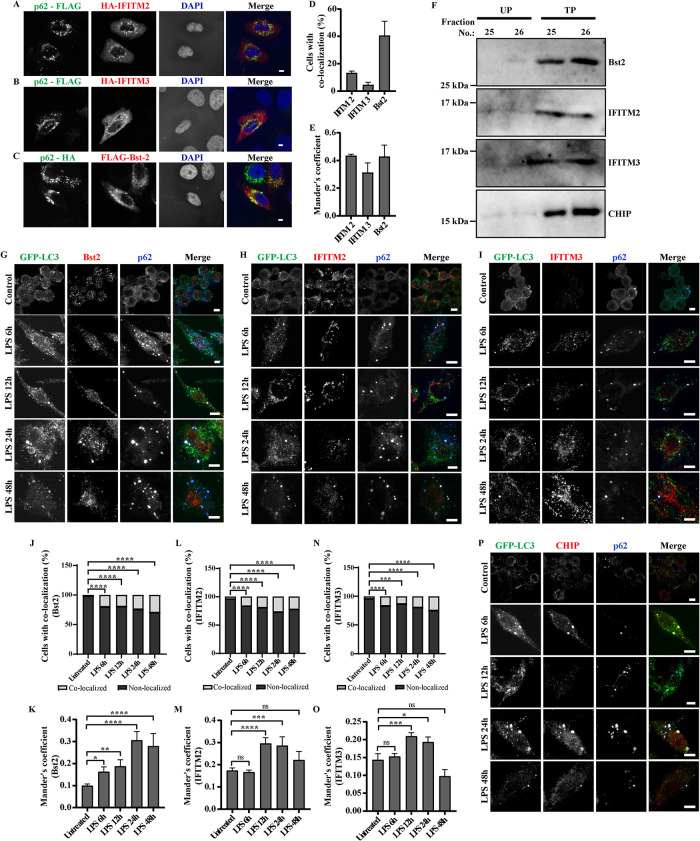
FIGURE 8:
Validation of association of AMPs identified from the mass spectrometry data with ALIS: HeLa cells cotransfected with pCMV-HA-hIFITM2 and pMY-IP-p62-FLAG (A), pCMV-HA-hIFITM3 and pMY-IP-p62-FLAG (B), and pFLAG-Bst2 and pMY-IP-p62-HA (C). Scale bars, 5 μm. Quantification of colocalization, counted manually and Mander’s correlation, between p62-FLAG with HA-IFITM2 or HA-IFITM3 and p62-HA with FLAG-Bst2 in HeLa cells. A minimum of 50 cells were considered for each experiment. Error bars indicate mean ± SEM from three independent experiments (D and E). Cells were stained for HA and FLAG. Immunoblots of SDG fractions UP25, UP 26, TP 25, and TP26, probed for Bst2, IFITM2, IFITM3, and CHIP (F). Images of RAW264.7 cells stably expressing GFP-LC3 after immunostaining for GFP and endogenous p62, along with endogenous levels of Bst2 (G), IFITM2 (H), IFITM3 (I), and CHIP/STUB1 (P) at 6, 12, 24, and 48 h of LPS stimulation. Scale bars, 5 μm. Quantification of colocalization, counted manually and Mander’s correlation coefficient, between GFP-LC3 dots and Bst2 (J and K), IFITM2 (L and M), IFITM3 (N and O), is shown. The graphs plotted indicate the fraction of total cells with colocalized and nonlocalized calculated for each time point and represented as percentage. Statistical significance was calculated on pooled data from experimental replicates using Fisher’s exact test upon comparing individual time points with untreated data. For IFITM2 and IFITM3, the experiments were performed in triplicates, and in duplicates for Bst2. A minimum 50 cells were counted for each repeat. Mander’s coefficient from individual cells is shown, a minimum of 30 cells were counted. (P) * < 0.05, (P) ** < 0.005, (P) *** < 0.0005, (P) **** < 0.0001, ns = nonsignificant.

