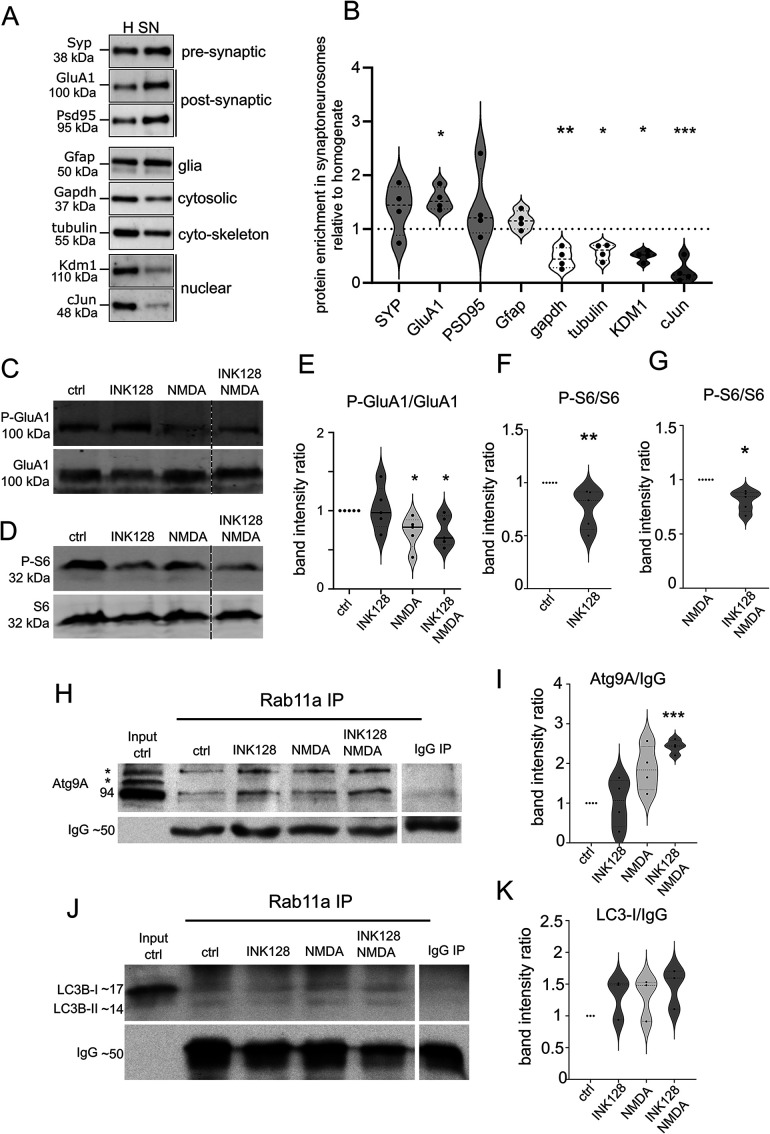
FIGURE 4:
Rab11a interacts with Atg9A in mouse synaptoneurosomes. (A and B) Western blot analysis of the fractions obtained during synaptoneurosomes (SN) preparation. Enrichment of both pre- and postsynaptic markers and depletion of cytosolic and nuclear markers in the SN fraction relative to the homogenate was observed. Glial marker (Gfap) was present, but not enriched (n = 4 biological replicates, paired t test, *p ≤ 0.05, **p ≤ 0.01, ***p ≤ 0.001). (C and E) Western blot analysis of NMDA stimulation in synaptoneurosomal preparations. Synaptoneurosomes were prepared as in Figure 4A, and levels of protein extracts were blotted against phosphorylated (Ser845; P-GluA1) and total GluA1 to evaluate GluA1 dephosphorylation. Dashed lines indicate membrane image cuts. Data are presented as mean gray values for each phosphorylated protein normalized to total protein. n = 5 for all samples. *p < 0.05, **p < 0.01 (one-sample t test). (D, F, and G) Western blot analysis of mTORC1 inhibition by INK128. Synaptoneurosome extracts were blotted against phosphorylated P-S6 (Ser235/236; C, D) and S6 to evaluate mTORC1 complex suppression. Dashed lines show membrane image cuts. Data are presented as mean gray values for each phosphorylated protein normalized to total protein. n = 5 for all samples. *p < 0.05, **p < 0.01 (one-sample t test). (H) Western blot analysis of Atg9A coimmunoprecipitation with Rab11a from mouse synaptoneurosomes. Samples were first subjected to the treatments and then coimmunoprecipitated with anti-Rab11a antibody (see Materials and Methods). The blot shows the control immunoprecipitation sample following the input fraction (precleared control synaptoneurosome extract). The samples were then treated with INK128 (600 nM) alone, NMDA (50 µM) alone, or NMDA+INK128. The bands marked as * corresponds to posttranslational modifications of Atg9A. (I) Atg9A signal intensity ratios of the respective samples. The lower band (Atg9A without posttranslational modifications) was used for quantification. Mean gray values were normalized to IgG as a loading control and then to the control sample. n = 4. ***p ≤ 0.001 (one-sample t test). (J) Western blot analysis of LC3B coimmunoprecipitation with Rab11a from mouse synaptoneurosomes prepared and treated as in (H). (K) LC3B western blot and signal intensity ratios, calculated as above. The band corresponding to LC3-I was used for quantitation to assess LC3B association with Rab11/Atg9A complex regardless of autophagic flux. n = 3.

