FIGURE 5:
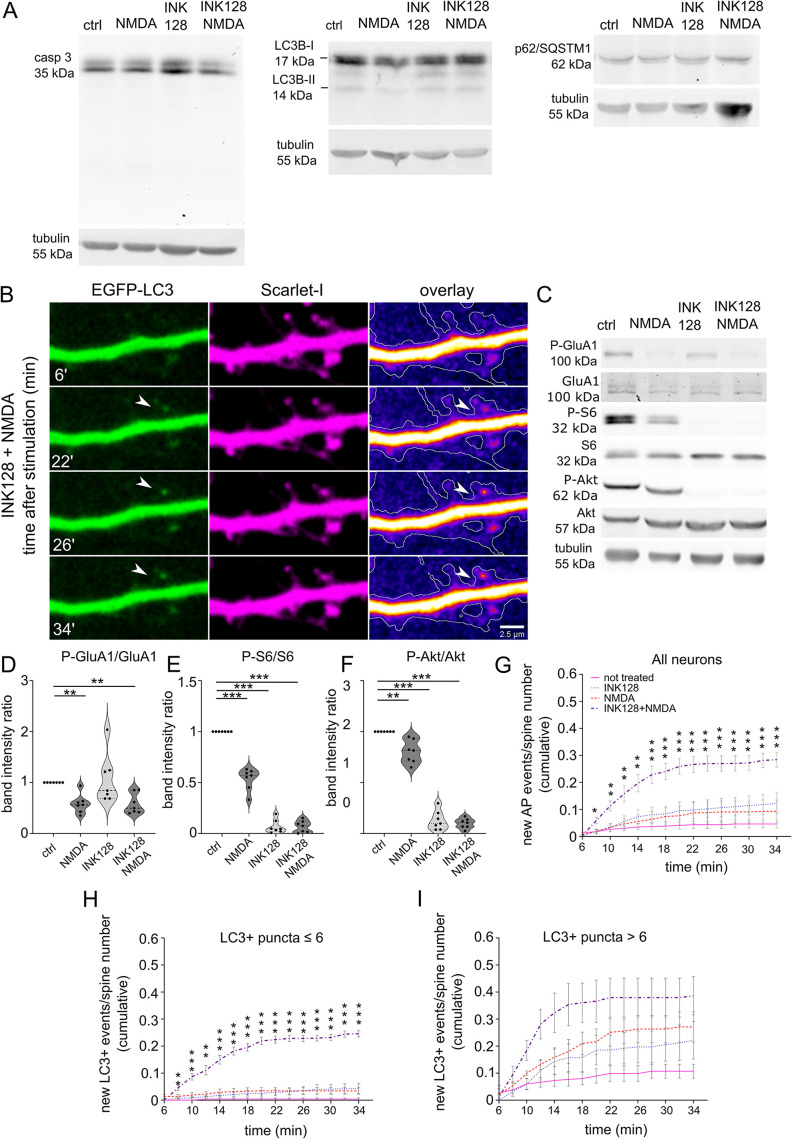
Simultaneous mTOR inhibition and NMDA stimulation induces the emergence of LC3+ vesicles at dendritic spines in rat hippocampal cultured neurons. (A) Western blot analysis of levels of caspase 3 (casp 3), LC3B, and p62 in primary hippocampal rat neurons (DIV21) treated with INK128 (300 nM) or DMSO for 15 min and then NMDA (50 µM) for 3 min followed by the medium changed, and incubation with DMSO or INK128 (300 nM) for next 35 min. Tubulin is shown as a loading control. (B) Representative images of a dendrite of a rat hippocampal neuron cotransfected with plasmids encoding EGFP-LC3 and Scarlet-I on DIV22 were treated the next day with INK128 (300 nM) and NMDA (50 µM). The arrow points to a new LC3+ vesicle emerging upon treatment. Scale bar = 2.5 µm. (C–F) Western blot analysis of NMDA application and mTORC1 and mTORC2 inhibition by INK128. Extracts treated as in (A) were blotted against phosphorylated (Ser845; P-GluA1) and total GluA1 to evaluate GluA1 dephosphorylation considered a marker for cLTD, P-S6 (Ser235/236), and S6 to evaluate mTORC1 complex suppression and P-Akt (Ser473) and Akt to evaluate mTORC2 suppression. Tubulin level serves as a loading control. Data are presented as mean gray values for each phosphorylated protein normalized to total protein. n = 7 for all samples. **p ≤ 0.01, ***p ≤ 0,001 (one-sample t test). (G) Neurons that were transfected as in (B) were either untreated or pretreated with INK128 (300 nM) for 15 min and then treated with NMDA for 3 min. The medium was then changed, and the neurons were incubated with or without INK128 (300 nM). Cumulative analysis of EGFP-LC3 vesicles showed that they appeared at dendritic spines at 2-min intervals, starting 6 min after NMDA application (shown as the total number of events normalized to the number of visible spines). Data are presented as a mean of cumulative events normalized to the number of spines for all time points and cells. Error bars show the standard error of the mean. Comparisons refer to the control cells in each time point, respectively. n = 14 control cells. n = 12 INK128-treated cells. n = 10 NMDA-treated cells. n = 11 INK128+NMDA-treated cells. *p ≤ 0.05, **p ≤ 0.01, ***p ≤ 0.001 (two-way ANOVA followed by Dunnett’s post hoc test). (H and I) Cumulative analysis of EGFP-LC3 vesicles of the same neurons as in (G), split into two groups with initial LC3+ puncta number ≤ 6 (H) or > 6 (I). Data are presented as a mean of cumulative events normalized to the number of spines for all time points and cells. Comparisons refer to the control cells in each time point, respectively. Error bars show the standard error of the mean. In (H): n = 11 for control cells, n = 7 for INK128-treated cells, n = 7 for NMDA-treated cells, n = 8 for INK128+NMDA-treated cells. In (I): n = 3 for control cells, n = 5 for INK128-treated cells, n = 3 for NMDA-treated cells, n = 3 for INK128+NMDA treated cells. *p ≤ 0.05, **p ≤ 0.01, ***p ≤ 0.001 (two-way ANOVA followed by Dunnett’s post hoc test).

