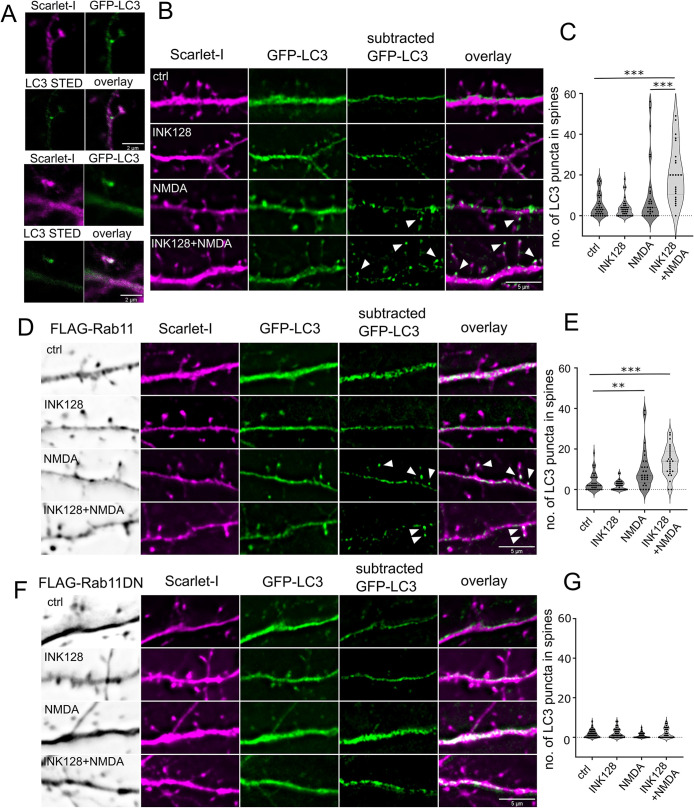
FIGURE 7:
Rab11 activity is necessary for LC3+ dendritic spine puncta increase upon NMDA application and mTOR inhibition. (A) Example confocal and STED images (20 nm resolution) of LC3+ puncta in the dendritic spine neck and head, respectively. The same cells were evaluated as in (B) The examples come from the INK128 + NMDA treatment variant. Scale bar = 2 µm. (B and C) 22 DIV neurons were transfected with plasmids expressing EGFP-LC3, Scarlet-I and pcDNA as a supplemental plasmid. Neurons were either untreated or pretreated with INK128 (300 nM) for 15 min and then treated with 20 µM NMDA for 5 min. The medium was then changed, and the neurons were incubated with or without INK128 (300 nM) with the addition of Baf1A (100 nm) as an inhibitor of autophagosome acidification. Following the experiment neurons were fixed and immunostained for FLAG-tag together with Rab11 WT and DN overexpressing neurons. Results present number of spherical/ovoid LC3+ puncta over ∼0.47 µm in diameter in the dendritic spine head or neck per cell in view. Scale bar = 5 µm. N = 4 independent experiments, n for each variant: ctrl = 36, INK128 = 35, NMDA = 29, INK128+NMDA = 26. Outliers (5) were removed with ROUT test with Q = 0.1%. Outlier removal with ROUT test did not change which comparisons were significant, nor p intervals. One way ANOVA with Tukey posttest, all columns were compared with all columns. Comparison of INK128 with INK128 NMDA variant was also significant (p ≤ 0.001) but not shown on the graph for clarity (* p ≤ 0.05, *** p ≤ 0.001). (D and E). Neurons from the same experiments with FLAG-Rab11 overexpression instead of pcDNA. Scale bar = 5 µm. N = 4 independent experiments, n for each variant: ctrl = 34, INK128 = 34, NMDA = 28, INK128+NMDA = 28. Outliers (6) were removed with ROUT test with Q = 0.1%. Outlier removal with ROUT test did not change, which comparisons were significant, nor p intervals. One way ANOVA with Tukey post hoc test, all columns were compared with all columns. Comparisons of INK128 with NMDA and INK128 NMDA variant were also significant (p ≤ 0.001) but not shown on the graph for clarity (**p ≤ 0.01, ***p ≤ 0.001). (F and G). Neurons from the same experiments with FLAG-Rab11 DN overexpression instead of pcDNA. Scale bar = 5 µm. N = 4 independent experiments, n for each variant: ctrl = 36, INK128 = 36, NMDA = 31, INK128+NMDA = 34. Outliers (8) were removed with ROUT test with Q = 0.1%. One way ANOVA with Tukey post hoc test, all columns were compared with all columns. Outlier removal with ROUT test did not change, which comparisons were significant, nor p intervals.

