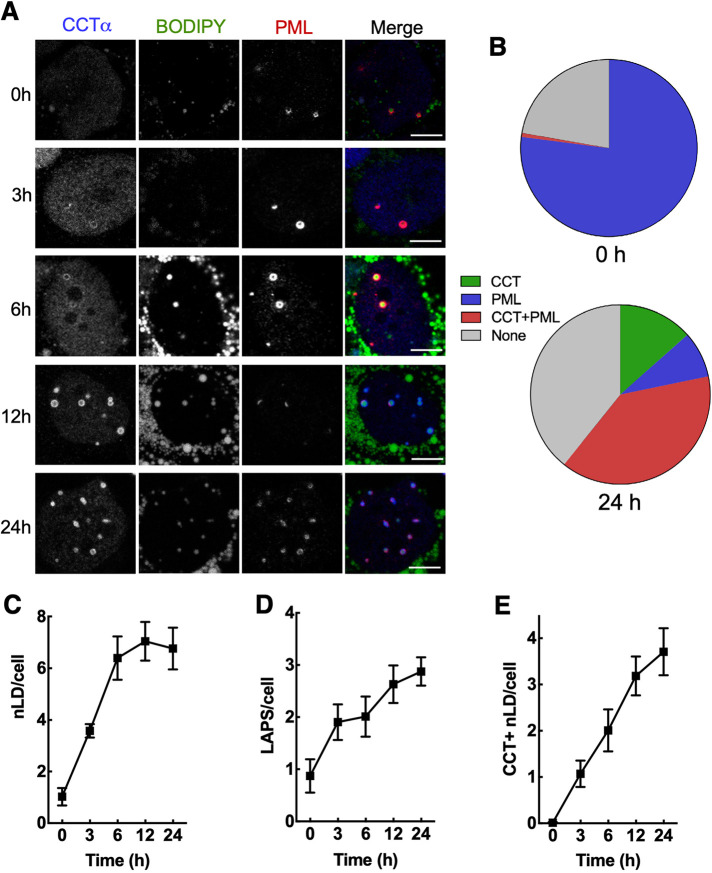
FIGURE 1:
Temporal association of CCTα with nLDs and LAPS in oleate-treated Huh7 cells. (A) Huh7 cells were treated with oleate (0.4 mM) for the indicated times and immunostained with antibodies against CCTα and PML. LDs were visualized with BODIPY 493/503 (bar, 5 μm). (B) mean percent distribution of CCTα and PML on nLDs at 0 and 24 h. (C–E) quantification of total BODIPY-positive nLDs (panel C), LAPS (panel D) and CCTα-positive nLDs (panel E). Results are the mean and SEM of 9–15 confocal images (10–20 cells per field) from three independent experiments.

