FIGURE 1:
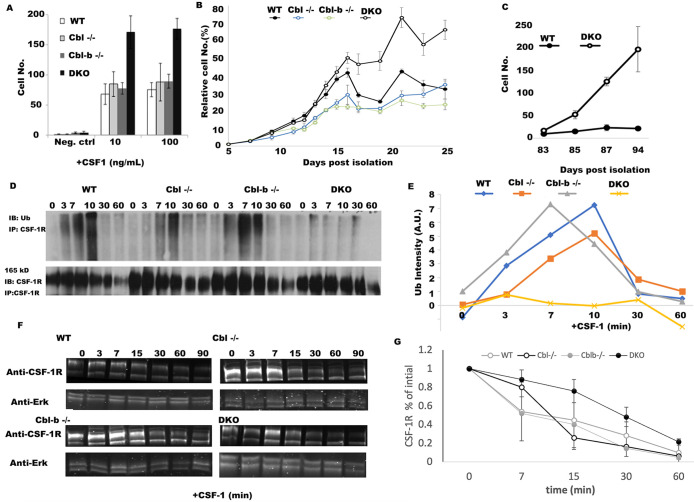
Cbl and Cbl-b DKO macrophages evade exit from the cell cycle and have minimal CSF-1R ubiquitination. (A) BMDM growth measured at day 6 postisolation (n = 5 fields of view and n = 3 replicates, error bar = std. dev.). (B) Growth curves, measured by alamar blue for WT, Cbl–/–, Cbl-b–/– and DKO BMDMs measured over 25 d from 1,000 cells starting at day 5 postisolation. CSF-1−containing media was added every other day followed by replating to a density of 1,000 cells/well (indicated by arrows, n = 6 replicates, error bars = std. dev.). (C) The growth rates between day 83 to day 94 of DKO and WT cells (n = 3 replicates, error bars are std. dev.). (D) CSF-1R immunoprecipitation and ubiquitin blot across BMDM of different genotypes following stimulation with CSF-1 (minutes after stimulation). (E) Quantification of D (data is representative of 3 independent experiments). F. CSF-1R western blot and quantification in BMDM stimulated with CSF-1 (after 0 min). Erk1/2 was used as a loading control. G. Quantification of CSF-1R degradation across three experiments (mean +/- std. dev.).

